
Page 42 - Guardian Broker Questionnaire Summary Complete Package 2 2 22_Neat
P. 42
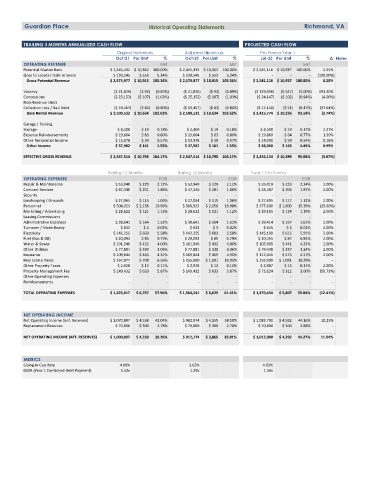
Guardian Place                          Historical Operating Statements                     Richmond, VA


         TRAILING 3 MONTHS ANNUALIZED CASH FLOW                                    PROJECTED CASH FLOW
                                        Original Historicals  Adjusted Historicals     Pro Forma Year 1
                                        Oct-21  Per Unit   %   Oct-21  Per Unit   %     Jul-23  Per Unit   %   Δ Notes
         OPERATING REVENUE                             Mkt                    Mkt                     Mkt
         Potential Market Rent       $ 2,445,432 $ 10,362  100.00%  $ 2,445,432 $ 10,362  100.00%  $ 2,581,116 $ 10,937  100.00%  5.55%
         (Loss to Lease) / Gain to Lease  $ 130,545  $ 553  5.34%  $ 130,545  $ 553  5.34%  -    -     -  (100.00%)
           Gross Potential Revenue   $ 2,575,977 $ 10,915 105.34%  $ 2,575,977 $ 10,915 105.34%  $ 2,581,116 $ 10,937 100.00%  0.20%
         Vacancy                       ($ 21,826)  ($ 92)  (0.89%)  ($ 21,826)  ($ 92)  (0.89%)  ($ 129,056)  ($ 547)  (5.00%)  491.30%
         Concessions                   ($ 25,152)  ($ 107)  (1.03%)  ($ 25,152)  ($ 107)  (1.03%)  ($ 24,147)  ($ 102)  (0.94%)  (4.00%)
         Non-Revenue Units                  -     -     -          -     -     -           -     -     -       -
         Collection Loss / Bad Debt    ($ 19,467)  ($ 82)  (0.80%)  ($ 19,467)  ($ 82)  (0.80%)  ($ 12,140)  ($ 51)  (0.47%)  (37.64%)
           Base Rental Revenue       $ 2,509,532 $ 10,634 102.62%  $ 2,509,532 $ 10,634 102.62%  $ 2,415,774 $ 10,236  93.59%  (3.74%)
         Garage / Parking                   -     -     -          -     -     -           -     -     -       -
         Storage                        $ 4,400  $ 19  0.18%   $ 4,400  $ 19  0.18%    $ 4,500  $ 19  0.17%  2.27%
         Expense Reimbursements        $ 19,604  $ 83  0.80%  $ 19,604  $ 83  0.80%   $ 19,860  $ 84  0.77%  1.30%
         Other Residential Income      $ 13,978  $ 59  0.57%  $ 13,978  $ 59  0.57%   $ 14,000  $ 59  0.54%  0.16%
           Other Income                $ 37,982  $ 161  1.55%  $ 37,982  $ 161  1.55%  $ 38,360  $ 163  1.49%  0.99%
         EFFECTIVE GROSS REVENUE     $ 2,547,514 $ 10,795 104.17%  $ 2,547,514 $ 10,795 104.17%  $ 2,454,134 $ 10,399  95.08%  (3.67%)

                                     Trailing 12 Months     Trailing 12 Months      Year 1 Pro Forma
         OPERATING EXPENSES                           EGR                    EGR                     EGR
         Repair & Maintenance          $ 53,940  $ 229  2.12%  $ 53,940  $ 229  2.12%  $ 55,019  $ 233  2.24%  2.00%
         Contract Services             $ 47,340  $ 201  1.86%  $ 47,340  $ 201  1.86%  $ 48,287  $ 205  1.97%  2.00%
         Security                           -     -     -          -     -     -           -     -     -       -
         Landscaping / Grounds         $ 27,064  $ 115  1.06%  $ 27,064  $ 115  1.06%  $ 27,605  $ 117  1.12%  2.00%
         Personnel                     $ 508,923  $ 2,156  19.98%  $ 508,923  $ 2,156  19.98%  $ 377,600  $ 1,600  15.39%  (25.80%)
         Marketing / Advertising       $ 28,622  $ 121  1.12%  $ 28,622  $ 121  1.12%  $ 29,195  $ 124  1.19%  2.00%
         Leasing Commissions                -     -     -          -     -     -           -     -     -       -
         Administrative Expenses       $ 38,641  $ 164  1.52%  $ 38,641  $ 164  1.52%  $ 39,414  $ 167  1.61%  2.00%
         Turnover / Make-Ready           $ 632   $ 3  0.02%     $ 632  $ 3  0.02%       $ 645   $ 3  0.03%  2.00%
         Electricity                   $ 142,255  $ 603  5.58%  $ 142,255  $ 603  5.58%  $ 145,100  $ 615  5.91%  2.00%
         Fuel (Gas & Oil)              $ 20,093  $ 85  0.79%  $ 20,093  $ 85  0.79%   $ 20,495  $ 87  0.84%  2.00%
         Water & Sewer                 $ 101,946  $ 432  4.00%  $ 101,946  $ 432  4.00%  $ 103,985  $ 441  4.24%  2.00%
         Other Utilities               $ 77,881  $ 330  3.06%  $ 77,881  $ 330  3.06%  $ 79,438  $ 337  3.24%  2.00%
         Insurance                     $ 109,844  $ 465  4.31%  $ 109,844  $ 465  4.31%  $ 112,041  $ 475  4.57%  2.00%
         Real Estate Taxes             $ 167,077  $ 708  6.56%  $ 255,000  $ 1,081  10.01%  $ 255,000  $ 1,081  10.39%  -
         Other Property Taxes           $ 2,928  $ 12  0.11%   $ 2,928  $ 12  0.11%    $ 2,987  $ 13  0.12%  2.00%
         Property Management Fee       $ 149,432  $ 633  5.87%  $ 149,432  $ 633  5.87%  $ 73,624  $ 312  3.00%  (50.73%)
         Other Operating Expenses           -     -     -          -     -     -           -     -     -       -
         Reimbursements                     -     -     -          -     -     -           -     -     -       -
         TOTAL OPERATING EXPENSES    $ 1,476,617  $ 6,257  57.96%  $ 1,564,541  $ 6,629  61.41%  $ 1,370,434  $ 5,807  55.84%  (12.41%)


         NET OPERATING INCOME
         Net Operating Income (bef. Reserves)  $ 1,070,897  $ 4,538  42.04%  $ 982,974  $ 4,165  38.59%  $ 1,083,700  $ 4,592  44.16%  10.25%
         Replacement Reserves          $ 70,800  $ 300  2.78%  $ 70,800  $ 300  2.78%  $ 70,800  $ 300  2.88%  -
         NET OPERATING INCOME (AFT. RESERVES)  $ 1,000,097  $ 4,238  39.26%  $ 912,174  $ 3,865  35.81%  $ 1,012,900  $ 4,292  41.27%  11.04%


         METRICS
         Going-In Cap Rate               4.00%                  3.65%                   4.05%
         DSCR (Year 1 Combined Debt Payment)  1.52x             1.39x                   1.54x