
Page 61 - Guardian Broker Questionnaire Summary Complete Package 2 2 22_Neat
P. 61
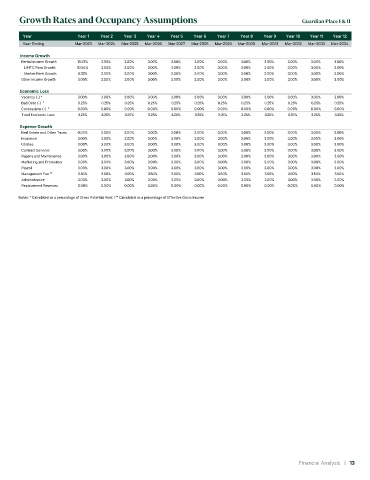
Growth Rates and Occupancy Assumptions                                                        Guardian Place I & II


         year              year 1  year 2  year 3  year 4  year 5  year 6  year 7  year 8  year 9  year 10  year 11  year 12
         Year Ending      Mar-2023  Mar-2024  Mar-2025  Mar-2026  Mar-2027  Mar-2028  Mar-2029  Mar-2030  Mar-2031  Mar-2032  Mar-2033  Mar-2034

        Income Growth
        Rental Income Growth  10.72%  3.00%  3.00%  3.00%  3.00%  3.00%  3.00%   3.00%  3.00%   3.00%   3.00%   3.00%
         LIHTC Rent Growth  10.94%  3.00%  3.00%  3.00%   3.00%  3.00%   3.00%   3.00%  3.00%   3.00%   3.00%   3.00%
         Market Rent Growth  8.38%  3.00%  3.00%  3.00%   3.00%  3.00%   3.00%   3.00%   3.00%  3.00%   3.00%   3.00%
        Other Income Growth  3.00%  3.00%  3.00%  3.00%   3.00%  3.00%   3.00%   3.00%   3.00%  3.00%   3.00%   3.00%
        Economic Loss
        Vacancy (-) *      3.00%  3.00%   3.00%   3.00%   3.00%  3.00%   3.00%   3.00%  3.00%   3.00%   3.00%   3.00%
        Bad Debt (-)  *    0.25%   0.25%  0.25%   0.25%   0.25%  0.25%   0.25%   0.25%   0.25%  0.25%   0.25%   0.25%
        Concessions (-)  *  0.00%  0.00%  0.00%   0.00%   0.00%  0.00%   0.00%   0.00%  0.00%   0.00%   0.00%   0.00%
        Total Economic Loss  3.25%  3.25%  3.25%  3.25%   3.25%  3.25%   3.25%   3.25%   3.25%  3.25%   3.25%   3.25%

        Expense Growth
        Real Estate and Other Taxes  0.00%  3.00%  3.00%  3.00%  3.00%  3.00%  3.00%  3.00%  3.00%  3.00%  3.00%  3.00%
        Insurance          3.00%  3.00%   3.00%   3.00%   3.00%  3.00%   3.00%   3.00%  3.00%   3.00%   3.00%   3.00%
        Utilities          3.00%   3.00%  3.00%   3.00%   3.00%  3.00%   3.00%   3.00%   3.00%  3.00%   3.00%   3.00%
        Contract Services  3.00%   3.00%  3.00%   3.00%   3.00%  3.00%   3.00%   3.00%   3.00%  3.00%   3.00%   3.00%
        Repairs and Maintenance  3.00%  3.00%  3.00%  3.00%  3.00%  3.00%  3.00%  3.00%  3.00%  3.00%   3.00%   3.00%
        Marketing and Promotion  3.00%  3.00%  3.00%  3.00%  3.00%  3.00%  3.00%  3.00%  3.00%  3.00%   3.00%   3.00%
        Payroll            3.00%   3.00%  3.00%   3.00%   3.00%  3.00%   3.00%   3.00%   3.00%  3.00%   3.00%   3.00%
        Management Fee **  3.50%   3.50%  3.50%   3.50%   3.50%  3.50%   3.50%   3.50%   3.50%  3.50%   3.50%   3.50%
        Administrative     3.00%   3.00%  3.00%   3.00%   3.00%  3.00%   3.00%   3.00%   3.00%  3.00%   3.00%   3.00%
        Replacement Reserves  0.00%  0.00%  0.00%  0.00%  0.00%  0.00%   0.00%   0.00%  0.00%   0.00%   0.00%   0.00%
       Notes: * Calculated as a percentage of Gross Potential Rent | ** Calculated as a percentage of Effective Gross Income


                                                                                                    Financial Analysis   |   13