
Page 62 - Guardian Broker Questionnaire Summary Complete Package 2 2 22_Neat
P. 62
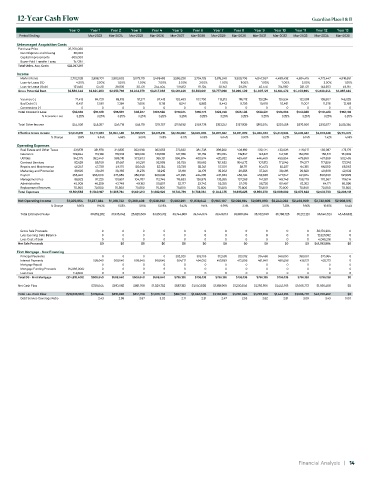
12-Year Cash Flow                                                                                Guardian Place I & II


                        year 0  year 1  year 2  year 3  year 4  year 5  year 6  year 7  year 8  year 9  year 10  year 11  year 12  year 13
       Period Ending          Mar-2023  Mar-2024  Mar-2025  Mar-2026  Mar-2027  Mar-2028  Mar-2029  Mar-2030  Mar-2031  Mar-2032  Mar-2033  Mar-2034  Mar-2035
       Unleveraged Acquisition Costs
       Purchase Price   32,250,000
        Due Diligence and Closing  35,000
        Capital Improvements  605,000
        Buyer-Paid Transfer Taxes  157,367
       Total Unlev. Acq. Costs  $33,047,367  $0  $0  $0  $0   $0     $0    $0     $0     $0     $0    $0      $0    $0
       Income
        Market Rents    2,702,028  2,896,701  2,983,602  3,073,110  3,491,493  3,596,238  3,704,125  3,815,248  3,929,706  4,047,597  4,499,432  4,634,415  4,773,447  4,916,651
        Loss-to-Lease (%)  4.50%  2.50%  1.00%  1.00%  7.00%  5.00%  3.00%  1.00%  1.00%  1.00%  7.00%  5.00%  3.00%  1.00%
        Loss-to-Lease (Gain)  121,580  72,418  29,836  30,731  244,404  179,812  111,124  38,152  39,297  40,476  314,960  231,721  143,203  49,167
       Gross Potential Rent  $2,580,448  $2,824,283  $2,953,766  $3,042,379  $3,247,088  $3,416,426  $3,593,001  $3,777,096  $3,890,409  $4,007,121  $4,184,472  $4,402,694  $4,630,244  $4,867,484
        Vacancy (-)       77,413  84,729  88,613  91,271  97,413  102,493  107,790  113,313  116,712  120,214  125,534  132,081  138,907  146,025
        Bad Debt (-)      6,451  7,061  7,384  7,606  8,118  8,541  8,983  9,443  9,726  10,018  10,461  11,007  11,576  12,169
        Concessions (-)     0      0     0      0      0      0      0     0      0      0      0      0      0      0
       Total Economic Loss  $83,865  $91,789  $95,997  $98,877  $105,530  $111,034  $116,773  $122,756  $126,438  $130,231  $135,995  $143,088  $150,483  $158,193
               % Economic Loss  3.25%  3.25%  3.25%  3.25%  3.25%  3.25%  3.25%  3.25%  3.25%  3.25%  3.25%  3.25%  3.25%  3.25%
       Total Other Income  $44,036  $45,357  $46,718  $48,119  $79,757  $112,690  $148,778  $153,241  $157,839  $162,574  $201,458  $276,926  $393,577  $405,384
       Effective Gross Income  $2,540,619  $2,777,851  $2,904,486  $2,991,621  $3,221,315  $3,418,082  $3,625,006  $3,807,582  $3,921,809  $4,039,463  $4,249,935  $4,536,532  $4,873,338  $5,114,675
                  % Change  1.59%  9.34%  4.56%  3.00%  7.68%  6.11%  6.05%  5.04%  3.00%  3.00%  5.21%  6.74%  7.42%  4.95%
       Operating Expenses
        Real Estate and Other Taxes  331,878  331,878  341,835  352,090  362,653  373,532  384,738  396,280  408,169  420,414  433,026  446,017  459,397  473,179
        Insurance        109,844  113,139  116,533  120,029  123,630  127,339  131,159  135,094  139,147  143,321  147,621  152,050  156,611  161,309
        Utilities        342,175  352,440  363,013  373,903  385,121  396,674  408,574  420,832  433,457  446,460  459,854  473,650  487,859  502,495
        Contract Services  82,629  85,108  87,661  90,291  92,999  95,789  98,663  101,623  104,672  107,812  111,046  114,377  117,809  121,343
        Repairs and Maintenance  46,347  47,738  49,170  50,645  52,164  53,729  55,341  57,001  58,711  60,473  62,287  64,155  66,080  68,063
        Marketing and Promotion  28,622  29,481  30,365  31,276  32,215  33,181  34,176  35,202  36,258  37,346  38,466  39,620  40,808  42,033
        Payroll          355,340  366,000  376,980  388,290  399,938  411,936  424,295  437,023  450,134  463,638  477,547  491,874  506,630  521,829
        Management Fee    88,922  97,225  101,657  104,707  112,746  119,633  126,875  133,265  137,263  141,381  148,748  158,779  170,567  179,014
        Administrative   45,008  46,359  47,749  49,182  50,657  52,177  53,742  55,355  57,015  58,726  60,487  62,302  64,171  66,096
        Replacement Reserves  70,800  70,800  70,800  70,800  70,800  70,800  70,800  70,800  70,800  70,800  70,800  70,800  70,800  70,800
       Total Expenses   $1,501,565  $1,540,167  $1,585,764  $1,631,213  $1,682,923  $1,734,791  $1,788,364  $1,842,475  $1,895,625  $1,950,370  $2,009,882  $2,073,623  $2,140,733  $2,206,161
       Net Operating Income  $1,039,054  $1,237,684  $1,318,722  $1,360,408  $1,538,392  $1,683,291  $1,836,642  $1,965,107  $2,026,184  $2,089,093  $2,240,052  $2,462,909  $2,732,605  $2,908,515
                  % Change  9.80%  19.12%  6.55%  3.16%  13.08%  9.42%  9.11%  6.99%  3.11%  3.10%  7.23%  9.95%  10.95%  6.44%
        Total Estimated Value  30,652,262  31,936,042  26,826,669  33,350,312  33,744,859  34,144,074  33,419,113  33,980,364  35,932,090  35,788,725  36,212,120  36,640,523  45,483,832

        Gross Sale Proceeds        0     0      0      0      0      0     0      0      0      0      0  58,170,294  0
        Less Existing Debt Balance  0     0     0      0      0      0     0      0      0      0      0  12,321,092  0
        Less Cost of Sale          0      0     0      0      0      0     0      0      0      0      0  4,065,218  0
       Net Sale Proceeds          $0     $0     $0     $0    $0     $0     $0     $0    $0     $0     $0  $41,783,984  $0
       First Mortgage - New Financing
        Principal Payments         0      0     0      0   292,020  302,105  312,538  323,332  334,498  346,050  358,001  370,364  0
        Interest Payments       508,640  508,640  508,640  508,640  504,117  494,032  483,599  472,806  461,640  450,088  438,137  425,773  0
        Mortgage Repaid            0      0     0      0      0      0     0      0      0      0      0      0      0
        Mortgage Funding Proceeds  (14,960,000)  0  0  0  0   0      0     0      0      0      0      0      0      0
        Loan Fees        149,600   0      0     0      0      0      0     0      0      0      0      0      0      0
       Total DS - First Mortgage  ($14,810,400)  $508,640  $508,640  $508,640  $508,640  $796,138  $796,138  $796,138  $796,138  $796,138  $796,138  $796,138  $796,138  $0
       Net Cash Flow           $729,044  $810,082  $851,768  $1,029,752  $887,153  $1,040,505  $1,168,969  $1,230,046  $1,292,956  $1,443,915  $1,666,772  $1,936,468  $0
       Total Lev. Cash Flow  ($18,236,967)  $729,044  $810,082  $851,768  $1,029,752  $887,153  $1,040,505  $1,168,969  $1,230,046  $1,292,956  $1,443,915  $1,666,772  $43,720,452  $0
        Debt Service Coverage Ratio  2.43  2.59  2.67  3.02  2.11   2.31  2.47   2.55   2.62   2.81  3.09    3.43  0.00


                                                                                                    Financial Analysis   |   14