
Page 60 - Guardian Broker Questionnaire Summary Complete Package 2 2 22_Neat
P. 60
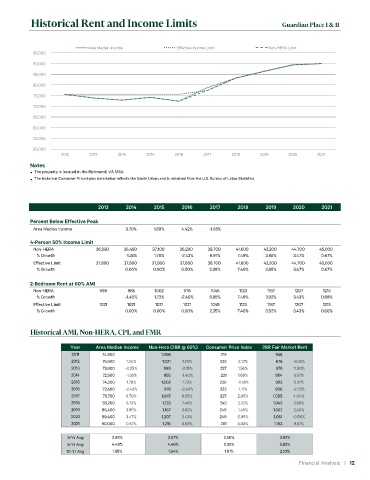
Historical Rent and Income Limits                                                  Guardian Place I & II


                              Area Median Income            Effective Income Limit        Non-HERA Limit
             95,000

             90,000
             85,000
             80,000
             75,000
             70,000

             65,000
             60,000
             55,000
             50,000
                     2012      2013     2014     2015      2016     2017      2018     2019     2020      2021
           Notes
            The property is located in the Richmond, VA MSA
            The historical Consumer Price Index data below reflects the South Urban and is obtained from the U.S. Bureau of Labor Statistics


                                 2013      2014     2015     2016     2017      2018     2019     2020     2021

           Percent Below Effective Peak
            Area Median Income             3.70%    1.89%    4.42%    -1.65%   0.00%     0.00%    0.00%    0.00%
           4-Person 50% Income Limit
            Non-HERA             36,950   36,450   37,100    36,200   38,700   41,600   43,200   44,700    45,000
             % Growth                      -1.35%   1.78%    -2.43%   6.91%     7.49%    3.85%    3.47%    0.67%
            Effective Limit      37,800   37,800   37,800    37,800   38,700   41,600   43,200   44,700    45,000
             % Growth                      0.00%    0.00%    0.00%    2.38%     7.49%    3.85%    3.47%    0.67%

           2-Bedroom Rent at 60% AMI
            Non-HERA              999      985      1002      978      1045     1123     1167     1207      1215
             % Growth                     -1.40%    1.73%    -2.40%   6.85%     7.46%    3.92%    3.43%    0.66%
            Effective Limit       1021     1021     1021      1021     1045     1123     1167     1207      1215
             % Growth                      0.00%    0.00%    0.00%    2.35%     7.46%    3.92%    3.43%    0.66%

           Historical AMI, Non-HERA, CPI, and FMR


                        year     area Median Income  non-Hera (2Br @ 60%)  Consumer Price Index  2Br Fair Market rent
                         2011      74,600             1,008               219               958
                         2012      75,600  1.34%       1,021  1.29%       223   2.12%       878   -8.35%
                         2013      73,900  -2.25%      999   -2.15%       227   1.56%       979   11.50%
                         2014      72,900  -1.35%      985   -1.40%       231   1.69%       984   0.51%
                         2015      74,200  1.78%      1,002  1.73%        230   -0.18%      993   0.91%
                         2016      72,400  -2.43%      978   -2.40%       233   1.11%       966   -2.72%
                         2017      78,700  8.70%      1,045  6.85%        237   2.05%      1,005  4.04%
                         2018      83,200  5.72%       1,123  7.46%       243   2.22%      1,042  3.68%
                         2019      86,400  3.85%       1,167  3.92%       246   1.45%      1,067  2.40%
                        2020       89,400  3.47%       1,207  3.43%       249   0.96%       1,061  -0.56%
                         2021      90,000  0.67%       1,215  0.66%       261   5.08%       1,163  9.61%

                       3-Yr Avg       2.66%              2.67%             2.50%              3.82%
                       5-Yr Avg       4.48%              4.46%             2.35%              3.83%
                       10-Yr Avg      1.95%              1.94%             1.81%              2.10%

                                                                                                    Financial Analysis   |   12