


Page 156 - MAT KS3 Y8 Cambridge CheckPoint
P. 156
15.4 Experimental and theoretical probabilities


               15.4 Experimental and theoretical probabilities


               One way to find probabilities is to use equally likely outcomes.
               Another way is to collect data from a survey or an experiment.  If you want to know the probability
                                                                               that a seed will germinate, you cannot
               Certain computer programs, called spreadsheets, have a
                                                                               use equally likely outcomes. You need
               random number generator that you can use to simulate
                                                                               to plant seeds and count how many
               throwing a dice.
                                                                               germinate.
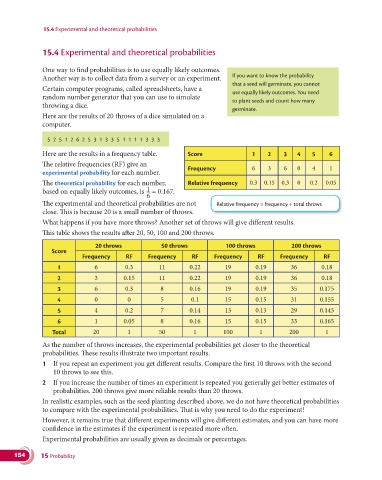
               Here are the results of 20 throws of a dice simulated on a
               computer.

                 5 2 5 1 2 6 2 5 3 1 3 3 5 1 1 1 1 3 3 3

               Here are the results in a frequency table.       Score                1    2     3   4    5     6

               The relative frequencies (RF) give an
               experimental probability for each number.        Frequency            6    3     6   0    4     1

               The theoretical probability for each number,     Relative frequency  0.3  0.15  0.3  0    0.2  0.05
                                                  1
               based on equally likely outcomes, is   = 0.167.
                                                  6
               The experimental and theoretical probabilities are not    Relative frequency = frequency ÷ total throws
               close. This is because 20 is a small number of throws.
               What happens if you have more throws? Another set of throws will give different results.
               This table shows the results after 20, 50, 100 and 200 throws.

                                 20 throws             50 throws            100 throws            200 throws
                  Score
                            Frequency      RF     Frequency      RF      Frequency     RF      Frequency     RF
                    1            6         0.3        11        0.22        19        0.19        36        0.18
                    2            3        0.15        11        0.22        19        0.19        36        0.18

                    3            6         0.3         8        0.16        19        0.19        35        0.175
                    4            0          0          5         0.1        15        0.15        31        0.155
                    5            4         0.2         7        0.14        13        0.13        29        0.145
                    6            1        0.05         8        0.16        15        0.15        33        0.165

                  Total         20          1         50          1         100         1         200         1
               As the number of throws increases, the experimental probabilities get closer to the theoretical
               probabilities. These results illustrate two important results.
               1   If you repeat an experiment you get different results. Compare the first 10 throws with the second
                   10 throws to see this.
               2   If you increase the number of times an experiment is repeated you generally get better estimates of
                   probabilities. 200 throws give more reliable results than 20 throws.
               In realistic examples, such as the seed planting described above, we do not have theoretical probabilities
               to compare with the experimental probabilities. That is why you need to do the experiment!
               However, it remains true that different experiments will give different estimates, and you can have more
               confidence in the estimates if the experiment is repeated more often.
               Experimental probabilities are usually given as decimals or percentages.

      154      15 Probability

