
Page 51 - HR and Green Economic Investment Opportunity - Editted2.
P. 51
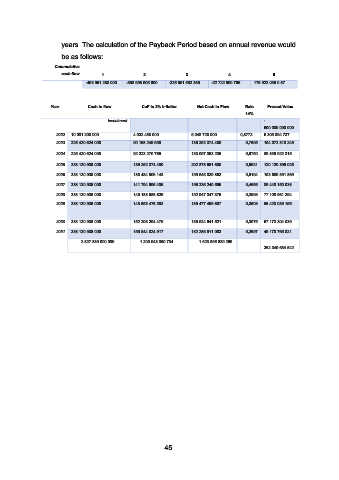
years. The calculation of the Payback Period based on annual revenue would

                      be as follows:
                    Cummulative
                       cash flow     1             2              3              4               5
                                -493.951.280.000   -358.698.905.600   -225.601.552.365   -22.722.990.765   176.923.039.087


                  Year          Cash in flow      CoF in 2% Inflation   Net Cash in Flow   Rate   Present Value
                                                                                       14%

                                       Investment                                            -
                                                                                             500.000.000.000
                     2022   10.081.200.000      4.032.480.000       6.048.720.000    0,8772    5.305.894.737
                     2023   225.420.624.000     90.168.249.600      135.252.374.400    0,7695   104.072.310.249
                     2024   225.420.624.000     92.323.270.765      133.097.353.235    0,6750   89.836.922.315

                     2025   338.130.936.000     135.252.374.400     202.878.561.600    0,5921   120.120.395.025
                     2026   338.130.936.000     138.484.906.148     199.646.029.852    0,5194   103.689.891.869
                     2027   338.130.936.000     141.794.695.405     196.336.240.595    0,4556   89.448.150.038
                     2028   338.130.936.000     145.183.588.625     192.947.347.375    0,3996   77.108.961.294
                     2029   338.130.936.000     148.653.476.393     189.477.459.607    0,3506   66.423.039.155


                     2030   338.130.936.000     152.206.294.479     185.924.641.521    0,3075   57.173.304.039
                     2031   338.130.936.000     155.844.024.917     182.286.911.083    0,2697   49.170.765.821
                                    2.827.839.000.000          1.203.943.360.734           1.623.895.639.266
                                                                                             262.349.634.542


                                                           45