
Page 668 - B2B All Year Round Vol.8
P. 668
AVERAGE NEW CAR CO 2 EMISSIONS MARKET TRENDS
a. Fuel Types
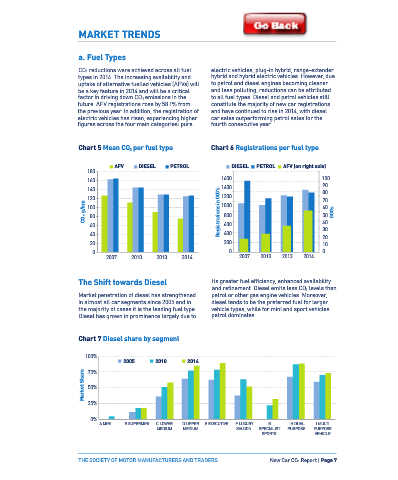
The graph below demonstrates a market shift has significantly increased since, and in 2014
towards lower emitting vehicles representing a 68.6% of UK new cars emitted less than 130g/ CO 2 reductions were achieved across all fuel electric vehicles, plug-in hybrid, range-extender
higher share of the market. In 2000, only 0.9% km of CO 2. This is an important improvement types in 2014. The increasing availability and hybrid and hybrid electric vehicles. However, due
of new cars registered fell under the 130g/ which illustrates that the UK is working towards uptake of alternative fuelled vehicles (AFVs) will to petrol and diesel engines becoming cleaner
km band, the 2015 EU target. This proportion reaching EU set targets. be a key feature in 2014 and will be a critical and less polluting, reductions can be attributed
factor in driving down CO 2 emissions in the to all fuel types. Diesel and petrol vehicles still
Chart 3 CO 2 distribution by VED bands future. AFV registrations rose by 58.1% from constitute the majority of new car registrations
the previous year. In addition, the registration of and have continued to rise in 2014, with diesel
15% electric vehicles has risen, experiencing higher car sales outperforming petrol sales for the
2000 2007 2013 2014 figures across the four main categories: pure fourth consecutive year.
Market Share 10% Chart 5 Mean CO 2 per fuel type Chart 6 Registrations per fuel type
5%
AFV (on right axis)
AFV
180 180 AFV AFV DIESEL DIESEL PETROL PETROL DIESEL DIESEL PETROL PETROL (on right axis)
160 160 1600 1600 100 100
0% 140 140 1400 1400 90 90
0 80 80
55 65 75 85 95 105 115 125 135 145 155 165 175 185 195 205 215 225 235 245 255 256 275 285 295 301+ 120 120 1200 1200 70 70
CO 2 g/km CO 2 g/km 100 CO 2 g/km 100 Registrations in 000’s 1000 Registrations in 000’s 1000 60 60
50 000’s
50 000’s
2014 also witnessed significant growth in of transport emissions, and there has been a 80 80 800 800 40 40
demand for alternative fuelled vehicles. greater push from government to encourage 60 60 600 600 30 30
Improvements were especially seen in the buyers through financial incentives. An example 40 40 400 400 20 20
greater uptake of pure and other electric is the Car and Van Plug-In Grant, in which the 20 20 200 200
vehicles, which is linked to stronger incentives UK offers up to £5,000 in grants for electric and 10 10
0
and regulation as well as improved consumer plug-in cars and up to £8,000 for vans, along 0 2007 2007 2010 2010 2013 2013 2014 2014 0 2007 0 2007 2010 2010 2013 2013 2014 0 0
2014
demand. New car registrations for plug-in with tax exemptions. Moreover, hybrid vehicles
electric vehicles grew four-fold, from 3,586 saw a significant increase in 2014 and remain
in 2013 to 14,498 in 2014. Consumers are dominant, driving the AFV market forward.
increasingly aware of the environmental costs The Shift towards Diesel its greater fuel efficiency, enhanced availability
and refinement. Diesel emits less CO 2 levels than
Chart 4 Electric vehicle registrations 2010 - 2014 Market penetration of diesel has strengthened petrol or other gas engine vehicles. Moreover,
in almost all car segments since 2005 and in diesel tends to be the preferred fuel for larger
60000 the majority of cases it is the leading fuel type. vehicle types, while for mini and sport vehicles
Diesel has grown in prominence largely due to petrol dominates.
Petrol/electric hybrid Diesel/electric hybrid Other electric Pure electric
50000
Chart 7 Diesel share by segment
Number of registrations 30000 Market Share 100% 2005 2010 2014
40000
75%
20000
50%
10000 25%
0%
G
H DUAL
I MULTI
0 A MINI B SUPERMINI C LOWER D UPPER E EXECUTIVE F LUXURY SPECIALIST PURPOSE PURPOSE
MEDIUM
SALOON
MEDIUM
2010 2011 2012 2013 2014 SPORTS VEHICLE
Note: other electric – plug-in hybrid and range-extenders
Page 6 | New Car CO 2 Report THE SOCIETY OF MOTOR MANUFACTURERS AND TRADERS THE SOCIETY OF MOTOR MANUFACTURERS AND TRADERS New Car CO 2 Report | Page 7