
Page 670 - B2B All Year Round Vol.8
P. 670
MARKET TRENDS MARKET TRENDS
The table that follows (Table 2) shows the best selling model in 2014, in each segment, and a petrol c. UK Car Parc the average CO 2 rating for all cars in the parc
and diesel version have been chosen to reflect an equivalent trim and power rate where possible. It was 160.2g/km, about 25% above the equivalent
shows that diesels on average emit between 1% and 28.5% less CO 2 than their petrol equivalent. The decade from 1997 to 2007 recorded new car CO 2 average. The 2014 estimate for
consistent growth in the total UK car parc. the car parc CO 2 average is 156.6 g/km. The
Table 2 Best selling model in 2014 by fuel type Average annual growth was 1.75% and the 2014 average is down by 1.4% on 2013 (160.2 g/
level of all cars in circulation, as measured km) and a 33.4 g/km difference in comparison
Market Sector Line Model Registrations Petrol Model Diesel Model Difference by SMMT, increased by 4.93 million to 31.106 to new cars CO 2 average. About 5% of cars
in 2014 CO 2 CO 2 million, implying robust and consistent growth in circulation have no recorded CO 2 rating.
A MINI HYUNDAI i10 25,030 108 n/a n/a in car ownership and availability. Between The average age of a car in circulation in Britain
B SUPERMINI FORD FIESTA 131,254 99 98 1.0% 2007 and 2014 the net growth in the UK car has increased to 7.8 years in 2014, from 6.8 years
parc more than halved to an annual average
C LOWER MEDIUM FORD FOCUS 85,140 114 109 4.4% of 0.7%. The consistent inflow of newer and in 2007. While car availability and ownership
D UPPER MEDIUM BMW 3 SERIES 38,649 147 118 19.7% increasingly more durable cars, the effects has continued to grow, the after-effects of the
E EXECUTIVE MERCEDES C CLASS 31,525 124 113 8.9% of the recent recession on new and used cars major recession of 2008/09 saw substantial
growth in new car leasing and rental-for-use
F LUXURY SALOON MERCEDES S CLASS 2,789 207 148 28.5% sales and the 2009/10 scrappage scheme ownership patterns. This will now begin to
G SPECIALIST MERCEDES SLK 5,451 151 132 12.6% are some of the factors affecting the UK car affect the timing and nature of returned cars
SPORTS parc. By 2014, the car parc level reached and the remarketing of two to four year-old
H DUAL PURPOSE FORD KUGA 24,353 154 139 9.7% 32.61 million, up by 4.8% since 2007, as buyers ex-lease cars and so the trading relationships
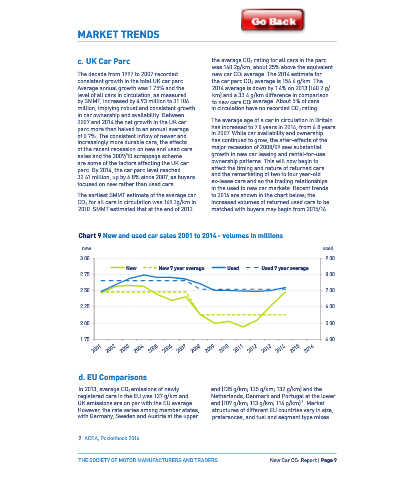
I MULTI PURPOSE CITROEN C4 PICASSO 19,164 145 105 27.6% focused on new rather than used cars. in the used to new car markets. Recent trends
The earliest SMMT estimate of the average car to 2014 are shown in the chart below; the
However, it is important to allocate the right fuel b. Segments CO 2 for all cars in circulation was 169.3g/km in increased volumes of returned used cars to be
type to the specific vehicle use. Dual and multi- 2010. SMMT estimated that at the end of 2013 matched with buyers may begin from 2015/16.
purpose vehicles tend to use diesel for greater CO 2 emissions have decreased across all nine
fuel efficiency when driving long distances, segments in 2014. The segment range from
1
which is similar for light commercial vehicles. Mini to Upper Medium vehicles continue to emit
Mini and supermini segments experience lower the lowest CO 2, illustrated below. Although Chart 9 New and used car sales 2001 to 2014 - volumes in millions
diesel penetration, as they tend to drive shorter Luxury and Dual Purpose segments still produce
journeys and can benefit more from petrol the most CO 2, there have been significant new used
vehicles due to their lower purchase cost. improvements in these segments since 2000.
3.00 9.00
Chart 8 Mean CO 2 by segment New New 7 year average Used Used 7 year average
2.75 8.00
350
2000 2007 2014
300 2.50 7.00
250
2.25 6.00
CO 2 g/km 150 2.00 5.00
200
100
1.75 4.00
50 2001 2002 2003 2005 2006 2007 2008 2009 2010 2011 2012 2013 2015 2016
0 2004 2014
Mini Supermini Lower Upper Executive Luxury Sports Dual MPV
Medium Medium Purpose
In 2014, ultra low emission vehicles, which by and availability of products, including smaller d. EU Comparisons
definition produce 75g/km or less of CO 2, were vehicles and those within the dual purpose and In 2013, average CO 2 emissions of newly end (135 g/km; 135 g/km; 132 g/km) and the
available in each of the nine segments, providing MPV segments, has helped to drive demand and registered cars in the EU was 127 g/km and Netherlands, Denmark and Portugal at the lower
more choice to buyers. Moreover, five of the has seen a shift away from once popular larger UK emissions are on par with the EU average. end (109 g/km; 113 g/km; 114 g/km) . Market
2
nine categories featured models with zero- family cars. However, the rate varies among member states, structures of different EU countries vary in size,
emission capabilities. This increasing diversity
with Germany, Sweden and Austria at the upper preferences, and fuel and segment type mixes.
1 The SMMT uses a classification system to recognise different segments of vehicles within the UK. This classi-
fication system relates to style and body size and varies from small to large with special categories assigned
to certain ‘cross-over’ vehicles. See the SMMT website for more details, at: http://www.smmt.co.uk/ 2 ACEA, Pocketbook 2014
Page 8 | New Car CO 2 Report THE SOCIETY OF MOTOR MANUFACTURERS AND TRADERS THE SOCIETY OF MOTOR MANUFACTURERS AND TRADERS New Car CO 2 Report | Page 9