
Page 277 - Operations Strategy
P. 277
252 CHAPTER 7 • ImPRovEmEnT sTRATEgy
processes that is the basis of capability development. Learning, therefore, is a funda-
mental part of operations improvement. Here we examine two views of how operations
learn. The first is the concept of the learning curve – a largely descriptive device that
attempts to quantify the rate of operational improvement over time. Then we look at
how operations’ learning is driven by the cyclical relationship between process control
and process knowledge.
the learning/experience curve
The relationship between the time taken to perform a task and the accumulated learn-
ing or experience was first formulated in the aircraft production industry in the 1930s.
The learning curve argues that the reduction in unit labour hours will be proportional
to the cumulative number of units produced, and that every time the cumulative out-
put doubles, the hours reduce by a fixed percentage. For example, in much labour-
intensive manufacturing (e.g. clothing manufacture) a reduction in hours per unit of
20 per cent is found every time cumulative production has doubled. This is called an
80 per cent learning curve. When plotted on log-log paper, such a curve will appear as
a straight line – making extrapolations (and strategic planning) more straightforward.
Such ‘learning’ curves are still used in the aerospace, electronics and defence industries.
The patterns that exist in labour hours have also been found when costs are examined.
They have been found not only in individual product costs, but also in operation and
industry-wide costs. When used to describe cost behaviour, the term ‘experience curve’
rather than learning curve is used. Where costs are not available, price has often been
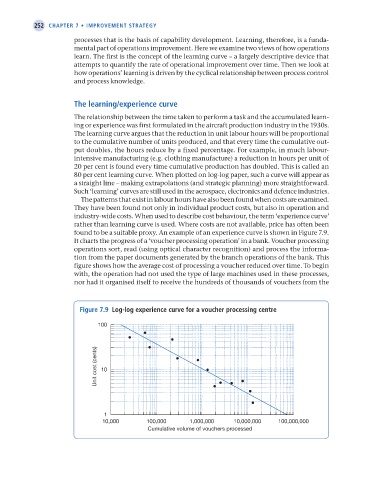
found to be a suitable proxy. An example of an experience curve is shown in Figure 7.9.
It charts the progress of a ‘voucher processing operation’ in a bank. Voucher processing
operations sort, read (using optical character recognition) and process the informa-
tion from the paper documents generated by the branch operations of the bank. This
figure shows how the average cost of processing a voucher reduced over time. To begin
with, the operation had not used the type of large machines used in these processes,
nor had it organised itself to receive the hundreds of thousands of vouchers from the
Figure 7.9 log-log experience curve for a voucher processing centre
100
Unit cost (cents) 10
1
10,000 100,000 1,000,000 10,000,000 100,000,000
Cumulative volume of vouchers processed
M07 Operations Strategy 62492.indd 252 02/03/2017 13:06