
Page 403 - Ranah Studi Agraria: Penguasaan Tanah dan Hubungan Agraris
P. 403
Ranah Studi Agraria
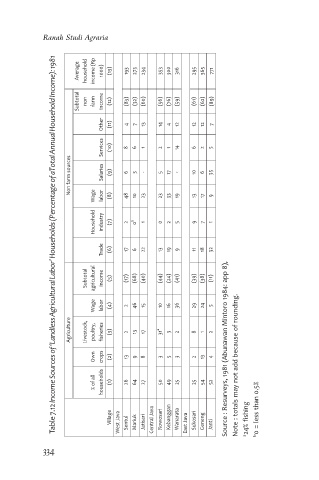
Table 7.12 Income Sources of ‘Landless Agricultural Labor’ Households (Percentage of aTotal Annual Household Income): 1981
Average household income (Rp 1000) (13) 193 273 234 353 300 316 295 365 771
Subtotal non farm income (12) (83) (32) (60) (56) (76) (59) (61) (62) (89)
Other (11) 4 7 13 14 4 12 12 12 7
Services (10) 8 6 1 2 1 14 6 2 5
Non farm sources Salaries (9) 6 3 - 5 17 - 10 6 35
Wage labor (8) 48 10 23 23 33 19 13 17 9
Household industry (7) 2 0 b 1 0 2 5 9 7 1
Trade (6) 17 6 22 13 19 9 11 18 32
Subtotal agricultural income (5) (17) (68) (40) (44) (24) (41) (39) (38) (11)
Wage labor (4) 2 46 15 10 16 36 29 24 5
Agriculture Livestock, poultry, fisheries (3) 2 13 17 31 a 3 2 8 1 2
Own crops (2) 13 9 8 3 5 3 2 13 4 Source : Resurveys, 1981 (Abunawan Mintoro 1984: app 8), Note : totals may not add because of rounding.
%ofall households (1) 26 64 27 50 49 25 25 54 52
Village West Java Sentul Mariuk Jatisari Central Java Rowosari Kebanggan Wanarata East Java Sukosari Geneng Janti a 24% fishing b 0 = less than 0.5%
334