
Page 406 - Ranah Studi Agraria: Penguasaan Tanah dan Hubungan Agraris
P. 406
Agrarian and Nonagrarian Bases ...
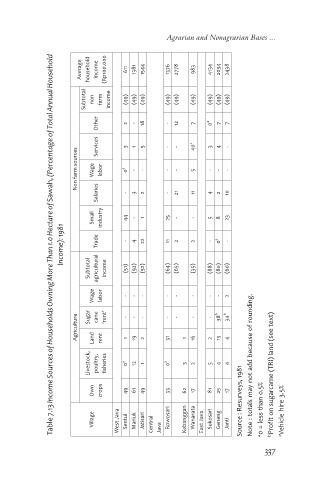
Table 7.13 Income Sources of Households Owning More Than 1.0 Hectare of Sawah, (Percentage of Total Annual Household
Average household income (Rp100.000 611 1381 1544 1376 2778 983 4134 2034 2438
Subtotal non farm income (49) (49) (49) (49) (49) (49) (49) (49) (49)
Other 2 - 18 - 12 7 0 a 7 7
Services 3 1 5 - - 40 c 3 4 -
Non farm sources Wage labor 0 a - - - - 5 - - -
Salaries - 3 2 - 21 11 4 2 10
Small industry 44 - 1 25 - - 5 8 23
Income): 1981 Trade - 4 22 11 2 2 - 0 a -
Subtotal agricultural income (51) (92) (52) (64) (65) (35) (88) (80) (60)
Wage labor - - - - - - - - 2
Agriculture Sugar Land cane rent ‘rent’ - 1 - 19 - 2 - 31 - 1 - 16 - 2 38 b 13 34 b 4
Livestock, poultry, fisheries 0 a 12 1 0 a 3 2 5 4 4 Note : totals may not add because of rounding. b Profit on sugarcame (TRI) land (see text)
Own crops 49 61 49 33 62 17 81 25 17 Source : Resurveys, 1981
Village West Java Sentul Mariuk Jatisari Central Java Rowosari Kebanggan Wanarata East Java Sukosari Geneng Janti a 0 = less than 0.5% c Vehicle hire 3.5%
337