
Page 470 - Microeconomics, Fourth Edition
P. 470
c11monopolyandmonopsony.qxd 7/14/10 7:58 PM Page 444
444 CHAPTER 11 MONOPOLY AND MONOPSONY
A CLOSER LOOK AT MARGINAL REVENUE:
MARGINAL UNITS AND INFRAMARGINAL UNITS
As we also showed in Chapter 9, for a price-taking firm, marginal revenue equals the
market price. For a monopolist, however, marginal revenue is not equal to market price.
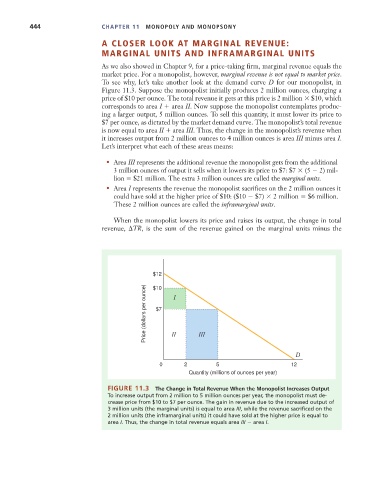
To see why, let’s take another look at the demand curve D for our monopolist, in
Figure 11.3. Suppose the monopolist initially produces 2 million ounces, charging a
price of $10 per ounce. The total revenue it gets at this price is 2 million $10, which
corresponds to area I area II. Now suppose the monopolist contemplates produc-
ing a larger output, 5 million ounces. To sell this quantity, it must lower its price to
$7 per ounce, as dictated by the market demand curve. The monopolist’s total revenue
is now equal to area II area III. Thus, the change in the monopolist’s revenue when
it increases output from 2 million ounces to 4 million ounces is area III minus area I.
Let’s interpret what each of these areas means:
• Area III represents the additional revenue the monopolist gets from the additional
3 million ounces of output it sells when it lowers its price to $7: $7 (5 2) mil-
lion $21 million. The extra 3 million ounces are called the marginal units.
• Area I represents the revenue the monopolist sacrifices on the 2 million ounces it
could have sold at the higher price of $10: ($10 $7) 2 million $6 million.
These 2 million ounces are called the inframarginal units.
When the monopolist lowers its price and raises its output, the change in total
revenue, TR, is the sum of the revenue gained on the marginal units minus the
$12
Price (dollars per ounce) $7 II I III
$10
D
0 2 5 12
Quantity (millions of ounces per year)
FIGURE 11.3 The Change in Total Revenue When the Monopolist Increases Output
To increase output from 2 million to 5 million ounces per year, the monopolist must de-
crease price from $10 to $7 per ounce. The gain in revenue due to the increased output of
3 million units (the marginal units) is equal to area III, while the revenue sacrificed on the
2 million units (the inframarginal units) it could have sold at the higher price is equal to
area I. Thus, the change in total revenue equals area III area I.