
Page 472 - Microeconomics, Fourth Edition
P. 472
c11monopolyandmonopsony.qxd 7/14/10 7:58 PM Page 446
446 CHAPTER 11 MONOPOLY AND MONOPSONY
TR (millions of dollars per year) When P = TR
$35
$7/ounce,
Q = 5, so
TR = $35
0 5 6
Quantity (millions of ounces per year)
(a) $12
Price, AR, MR (dollars per ounce) $10 ΔP When Q = 5, P = $7/ounce
and TR = $35. Thus, AR = $35/5 = $7
$7
ΔP/ΔQ = –$1/ounce, so when Q = 5 and
P = $7/ounce, MR = $7 + (–$1)5 = $2/ounce
$2
12
0 2 ΔQ 5 MR D = AR
6
Quantity (millions of ounces per year)
(b)
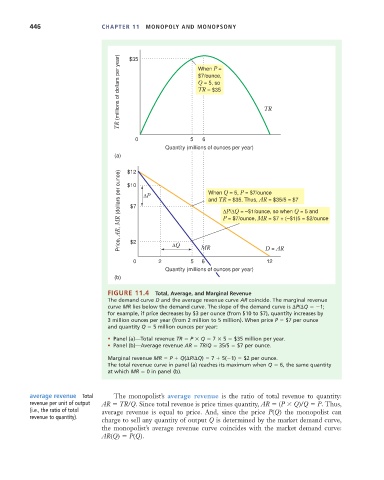
FIGURE 11.4 Total, Average, and Marginal Revenue
The demand curve D and the average revenue curve AR coincide. The marginal revenue
curve MR lies below the demand curve. The slope of the demand curve is P/ Q 1;
for example, if price decreases by $3 per ounce (from $10 to $7), quantity increases by
3 million ounces per year (from 2 million to 5 million). When price P $7 per ounce
and quantity Q 5 million ounces per year:
• Panel (a)—Total revenue TR P Q 7 5 $35 million per year.
• Panel (b)—Average revenue AR TR/Q 35/5 $7 per ounce.
Marginal revenue MR P Q( P/ Q) 7 5( 1) $2 per ounce.
The total revenue curve in panel (a) reaches its maximum when Q 6, the same quantity
at which MR 0 in panel (b).
average revenue Total The monopolist’s average revenue is the ratio of total revenue to quantity:
revenue per unit of output AR TR/Q. Since total revenue is price times quantity, AR (P Q)/Q P. Thus,
(i.e., the ratio of total average revenue is equal to price. And, since the price P(Q) the monopolist can
revenue to quantity).
charge to sell any quantity of output Q is determined by the market demand curve,
the monopolist’s average revenue curve coincides with the market demand curve:
AR(Q) P(Q).