
Page 608 - Microeconomics, Fourth Edition
P. 608
c14gametheoryandstrategicbehavior.qxd 8/6/10 8:22 AM Page 582
582 CHAPTER 14 GAME THEORY AND STRATEGIC BEHAVIOR
LEARNING-BY-DOING EXERCISE 14.2
S
E D
Finding All of the Nash Equilibria in a Game
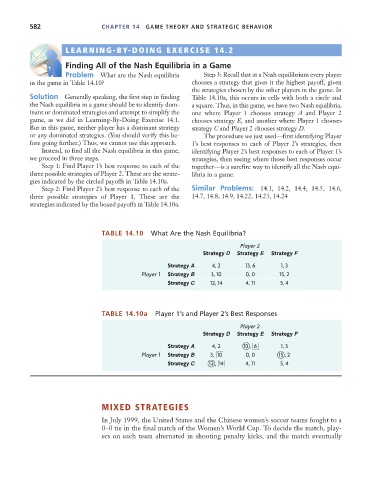
Problem What are the Nash equilibria Step 3: Recall that at a Nash equilibrium every player
in the game in Table 14.10? chooses a strategy that gives it the highest payoff, given
the strategies chosen by the other players in the game. In
Solution Generally speaking, the first step in finding Table 14.10a, this occurs in cells with both a circle and
the Nash equilibria in a game should be to identify dom- a square. Thus, in this game, we have two Nash equilibria,
inant or dominated strategies and attempt to simplify the one where Player 1 chooses strategy A and Player 2
game, as we did in Learning-By-Doing Exercise 14.1. chooses strategy E, and another where Player 1 chooses
But in this game, neither player has a dominant strategy strategy C and Player 2 chooses strategy D.
or any dominated strategies. (You should verify this be- The procedure we just used—first identifying Player
fore going further.) Thus, we cannot use this approach. 1’s best responses to each of Player 2’s strategies, then
Instead, to find all the Nash equilibria in this game, identifying Player 2’s best responses to each of Player 1’s
we proceed in three steps. strategies, then seeing where those best responses occur
Step 1: Find Player 1’s best response to each of the together—is a surefire way to identify all the Nash equi-
three possible strategies of Player 2. These are the strate- libria in a game.
gies indicated by the circled payoffs in Table 14.10a.
Step 2: Find Player 2’s best response to each of the Similar Problems: 14.1, 14.2, 14.4, 14.5, 14.6,
three possible strategies of Player 1. These are the 14.7, 14.8, 14.9, 14.22, 14.23, 14.24
strategies indicated by the boxed payoffs in Table 14.10a.
TABLE 14.10 What Are the Nash Equilibria?
Player 2
Strategy D Strategy E Strategy F
Strategy A 4, 2 13, 6 1, 3
Player 1 Strategy B 3, 10 0, 0 15, 2
Strategy C 12, 14 4, 11 5, 4
TABLE 14.10a Player 1’s and Player 2’s Best Responses
Player 2
Strategy D Strategy E Strategy F
Strategy A 4, 2 13 , 6 1, 3
Player 1 Strategy B 3, 10 0, 0 15 , 2
Strategy C 12 , 14 4, 11 5, 4
MIXED STRATEGIES
In July 1999, the United States and the Chinese women’s soccer teams fought to a
0–0 tie in the final match of the Women’s World Cup. To decide the match, play-
ers on each team alternated in shooting penalty kicks, and the match eventually