Page 767 - Microeconomics, Fourth Edition
P. 767

BMappAMathematicalAppendix.qxd  8/17/10  1:10 AM  Page 741


                                                                 A.6 MULTIVARIABLE FUNCTIONS                    741
                      of calculus, the firm chooses  Q so that  dp/dQ   0. The  variables. For example, the profit for a firm, p, may depend
                      derivative of p is                              on the amounts of two outputs, Q 1 being the amount of the
                                                                      first good it produces and  Q 2 the amount of the second
                                     dp   dR   dC
                                                                      good. Suppose the profit function for the firm is
                                     dQ   dQ   dQ
                                                                                         2
                                                                          p   13Q 1   2(Q 1 )   Q 1 Q 2   8Q 2   2(Q 2 ) 2  (A.10)
                      where dR/dQ is the marginal revenue and dC/dQ is the mar-
                      ginal cost. Thus, the firm must choose Q so that marginal
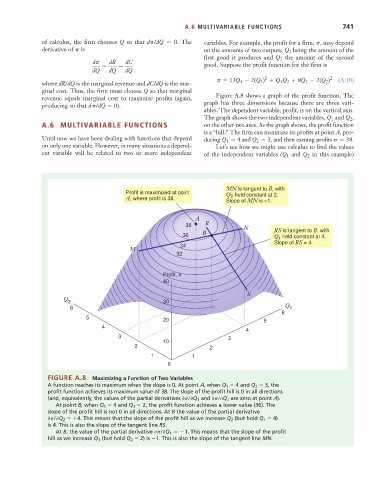
                      revenue equals marginal cost to maximize profits (again,  Figure A.8 shows a graph of the profit function. The
                      producing so that dp/dQ   0).                   graph has three dimensions because there are three vari-
                                                                      ables. The dependent variable, profit, is on the vertical axis.
                                                                      The graph shows the two independent variables, Q 1 and Q 2 ,
                      A.6  MULTIVARIABLE FUNCTIONS                    on the other two axes. As the graph shows, the profit function
                                                                      is a “hill.” The firm can maximize its profits at point A, pro-
                      Until now we have been dealing with functions that depend  ducing Q 1   4  and Q 2   3 , and then earning profits p   38 .
                      on only one variable. However, in many situations a depend-  Let’s see how we might use calculus to find the values
                      ent variable will be related to two or more independent  of the independent variables (Q 1 and Q 2 in this example)


                                                                             MN is tangent to B, with
                                               Profit is maximized at point  Q  held constant at 2.
                                                                              2
                                               A, where profit is 38.        Slope of MN is –1.
                                                                    A
                                                                 38    R          N
                                                                      B                    RS is tangent to B, with
                                                                36                         Q  held constant at 4.
                                                                                             1
                                                                                           Slope of RS = 4.
                                                M              34
                                                              32

                                                          Profit, π
                                                          40

                                                                                   S
                            Q
                              2                           30
                              6                                                                Q 1
                                                                                              6
                                   5
                                                          20                            5
                                        4
                                                                                   4
                                             3                                3
                                                          10
                                                  2                     2
                                                      1            1
                                                           0
                       FIGURE A.8    Maximizing a Function of Two Variables
                       A function reaches its maximum when the slope is 0. At point A, when Q 1   4 and Q 2   3, the
                        profit function achieves its maximum value of 38. The slope of the profit hill is 0 in all directions
                        (and, equivalently, the values of the partial derivatives 0p/0Q 1  and 0p/0Q 2  are zero at point A).
                          At point B, when Q 1   4 and Q 2   2, the profit function achieves a lower value (36). The
                        slope of the profit hill is not 0 in all directions. At B the value of the partial derivative
                        0p/0Q 2   4 . This means that the slope of the profit hill as we increase Q 2 (but hold Q 1   4)
                        is 4. This is also the slope of the tangent line RS.
                          At B, the value of the partial derivative 0p/0Q 1   1 . This means that the slope of the profit
                        hill as we increase Q 1 (but hold Q 2   2) is  1. This is also the slope of the tangent line MN.
   762   763   764   765   766   767   768   769   770   771   772