
Page 338 - Fiber Optic Communications Fund
P. 338
Transmission System Design 319
x 10 –16
3.5
3
2.5
2
ρ eq ASE
1.5
1
0.5
0
0 50 100 150
Amplifier spacing, L (km)
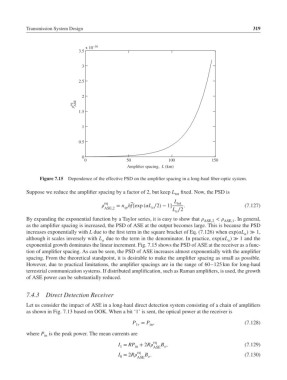
Figure 7.15 Dependence of the effective PSD on the amplifier spacing in a long-haul fiber-optic system.
Suppose we reduce the amplifier spacing by a factor of 2, but keep L fixed. Now, the PSD is
tot
L
eq tot
= n hf[exp (L ∕2)− 1] . (7.127)
ASE,2 sp a L ∕2
a
By expanding the exponential function by a Taylor series, it is easy to show that ASE,2 < ASE,1 . In general,
as the amplifier spacing is increased, the PSD of ASE at the output becomes large. This is because the PSD
increases exponentially with L due to the first term in the square bracket of Eq. (7.126) when exp(L ) ≫ 1,
a
although it scales inversely with L due to the term in the denominator. In practice, exp(L ) ≫ 1 and the
a a
exponential growth dominates the linear increment. Fig. 7.15 shows the PSD of ASE at the receiver as a func-
tion of amplifier spacing. As can be seen, the PSD of ASE increases almost exponentially with the amplifier
spacing. From the theoretical standpoint, it is desirable to make the amplifier spacing as small as possible.
However, due to practical limitations, the amplifier spacings are in the range of 60–125 km for long-haul
terrestrial communication systems. If distributed amplification, such as Raman amplifiers, is used, the growth
of ASE power can be substantially reduced.
7.4.3 Direct Detection Receiver
Let us consider the impact of ASE in a long-haul direct detection system consisting of a chain of amplifiers
as shown in Fig. 7.13 based on OOK. When a bit ‘1’ is sent, the optical power at the receiver is
P = P , (7.128)
in
1r
where P is the peak power. The mean currents are
in
eq
I = RP + 2R B , (7.129)
1 in ASE o
eq
I = 2R ASE o (7.130)
B .
0