
Page 486 - Fiber Optic Communications Fund
P. 486
Nonlinear Effects in Fibers 467
and post , respectively. Dispersion of the TF is partially compensated by the in-line dispersion compensation.
Let res be the residual accumulated dispersion of a single span, i.e.,
res = D L + D inline inline , (10.314)
L
TF TF
where D and L denote the dispersion parameter (see Chapter 2) and length, respectively, and the subscripts
TF and inline correspond to the transmission fiber and inline DCF, respectively. We have assumed that the
total accumulated dispersion from transmitter to receiver is zero, i.e.,
pre + N res + post = 0, (10.315)
where N is the number of TF spans. The following parameters are used in the numerical simulation of the
direct detection OOK system. Bit rate = 40 Gb/s, pulsewidth (FWHM) = 5ps, N = 10, peak powers launched
to TF and DCF are 10 dBm and 0 dBm, respectively. The lengths of pre-, inline, and post-compensating
fibers are chosen so that = 100 ps/nm and = =−500 ps/nm. The amplifier noise is turned off.
res post pre
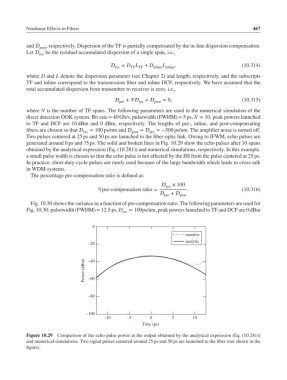
Two pulses centered at 25 ps and 50 ps are launched to the fiber-optic link. Owing to IFWM, echo pulses are
generated around 0 ps and 75 ps. The solid and broken lines in Fig. 10.29 show the echo pulses after 10 spans
obtained by the analytical expression (Eq. (10.281)) and numerical simulations, respectively. In this example,
a small pulse width is chosen so that the echo pulse is not affected by the ISI from the pulse centered at 25 ps.
In practice, short-duty-cycle pulses are rarely used because of the large bandwidth which leads to cross-talk
in WDM systems.
The percentage pre-compensation ratio is defined as
pre × 100
%pre-compensation ratio = . (10.316)
+
pre post
Fig. 10.30 shows the variance as a function of pre-compensation ratio. The following parameters are used for
Fig. 10.30: pulsewidth (FWHM) = 12.5 ps, D res = 100ps/nm, peak powers launched to TF and DCF are 0 dBm
0
numeric
analytic
–20
Power (dBm) –40
–60
–80
–100
–10 –5 0 5 10
Time (ps)
Figure 10.29 Comparison of the echo pulse power at the output obtained by the analytical expression (Eq. (10.281))
and numerical simulations. Two signal pulses centered around 25 ps and 50 ps are launched to the fiber (not shown in the
figure).