Page 487 - Fiber Optic Communications Fund
P. 487

468                                                               Fiber Optic Communications


                                     × 10 –3


                                   1.5      numeric
                                            analytic

                                 Variance (mW)  1


                                   0.5


                                    0
                                     0       20      40      60      80      100
                                                   % Pre−compensation

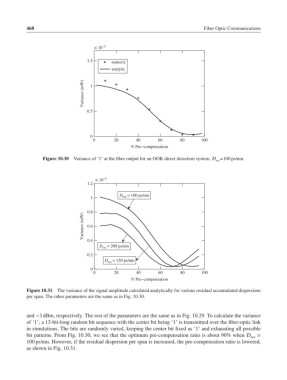
                  Figure 10.30  Variance of ‘1’ at the fiber output for an OOK direct detection system.  =100 ps/nm.
                                                                                  res


                                      × 10 –3
                                   1.2
                                               D res  = 100 ps/nm
                                    1

                                   0.8
                                 Variance (mW)  0.6


                                   0.4
                                       D res  = 200 ps/nm
                                   0.2
                                         D res  = 150 ps/nm
                                    0
                                     0       20      40      60      80      100
                                                   % Pre−compensation
            Figure 10.31  The variance of the signal amplitude calculated analytically for various residual accumulated dispersions
            per span. The other parameters are the same as in Fig. 10.30.


            and −3 dBm, respectively. The rest of the parameters are the same as in Fig. 10.29. To calculate the variance
            of ‘1’, a 13-bit-long random bit sequence with the center bit being ‘1’ is transmitted over the fiber-optic link
            in simulations. The bits are randomly varied, keeping the center bit fixed as ‘1’ and exhausting all possible
            bit patterns. From Fig. 10.30, we see that the optimum pre-compensation ratio is about 90% when  res  =
            100 ps/nm. However, if the residual dispersion per span is increased, the pre-compensation ratio is lowered,
            as shown in Fig. 10.31.
   482   483   484   485   486   487   488   489   490   491   492