
Page 165 - Essentials of Human Communication
P. 165
144 ChApteR 7 Interpersonal Relationships
Communication ● Storge love is a peaceful and tranquil love. Like ludic love, storge lacks passion and
Choice point intensity. Storgic lovers set out not to find a lover but to establish a companionable
Compliance Resisting relationship with someone they know and with whom they can share interests and
Your friend asks you for a loan activities. Storgic love is a gradual process of unfolding thoughts and feelings and
of $150 to pay off some bills. Unfortunately, is sometimes difficult to distinguish from friendship.
you’ve never been paid back when you’ve ● Pragma love is practical and traditional and seeks compatibility and a relationship
lent money in the past, so you don’t want to in which important needs and desires will be satisfied. The pragma lover is con-
do it again. Yet you don’t want to lose this cerned with the social qualifications of a potential mate even more than with
otherwise good friend. What would you say?
personal qualities; family and background are extremely important to the pragma
lover, who relies not so much on feelings as on logic.
● Manic love is an obsessive love that needs to give and receive constant attention and
affection. When attention and affection are not constant, or when an expression of
Explore the Exercise increased commitment is not returned, reactions such as depression, jealousy, and
“What Type of Relationship self-doubt can lead to extreme lows.
Do You Prefer?” at
MyCommunicationLab ● Agapic love is compassionate and selfless. The agapic lover loves both the stranger on the
road and the annoying neighbor. Jesus, Buddha, and Gandhi practiced and preached this
unqualified spiritual love—a love that is offered without concern for personal reward or
gain and without any expectation that the love will be reciprocated.
Communication Men and women differ in the types of love they prefer (Hendrick, Hendrick,
Choice point Foote, & Slapion-Foote, 1984). For example, men indicate a preference for erotic and
accepting a Date ludic love, whereas women indicate a preference for manic, pragmatic, and storgic
A fellow student in one of love. No difference was found for agapic love. Women and men seem to experience
your classes asks you for a date. You’re really love to a similar degree (Rubin, 1973). However, women indicate greater love than
very excited and have been waiting for this men do for their same-sex friends. This may reflect a real difference between the
all semester. What are your options for com- sexes, or it may be a function of the greater social restrictions on men. A man is not
municating a clear yes, but without appearing
overly eager? supposed to admit his love for another man, but women are permitted to communi-
cate their love for other women.
FaMily RelatiOnShipS
Families are central to contemporary life. It will come as no surprise to note that families
come in various configurations and are undergoing major changes. Table 7.1 provides a few
findings from the U.S. Census to illustrate some of the major changes.
The communication principles that apply to the traditional nuclear family (i.e., the mother-
father-child family) also apply to all family configurations. In the discussion that follows, the
term primary relationship denotes the relationship between two principal parties—husband
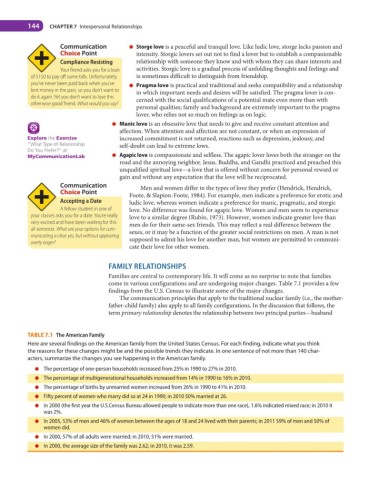
TAble 7.1 the american Family
Here are several findings on the American family from the United States Census. For each finding, indicate what you think
the reasons for these changes might be and the possible trends they indicate. In one sentence of not more than 140 char-
acters, summarize the changes you see happening in the American family.
● The percentage of one-person households increased from 25% in 1990 to 27% in 2010.
● The percentage of multigenerational households increased from 14% in 1990 to 16% in 2010.
● The percentage of births by unmarried women increased from 26% in 1990 to 41% in 2010.
● Fifty percent of women who marry did so at 24 in 1990; in 2010 50% married at 26.
● In 2000 (the first year the U.S.Census Bureau allowed people to indicate more than one race), 1.6% indicated mixed race; in 2010 it
was 2%.
● In 2005, 53% of men and 46% of women between the ages of 18 and 24 lived with their parents; in 2011 59% of men and 50% of
women did.
● In 2000, 57% of all adults were married; in 2010, 51% were married.
● In 2000, the average size of the family was 2.62; in 2010, it was 2.59.