
Page 16 - FINAL CFA II SLIDES JUNE 2019 DAY 7
P. 16
LOS 28.i: Explain how to forecast industry and
company sales and costs when they are subject to READING 28: INDUSTRY AND COMPANY ANALYSIS
price inflation or deflation.
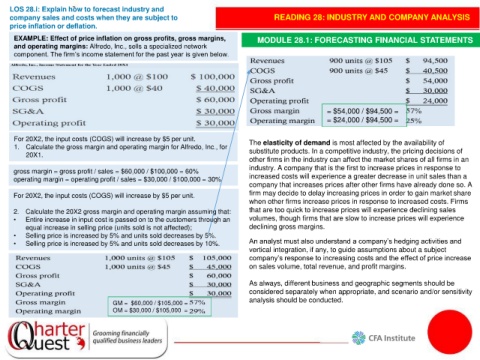
EXAMPLE: Effect of price inflation on gross profits, gross margins, MODULE 28.1: FORECASTING FINANCIAL STATEMENTS
and operating margins: Alfredo, Inc., sells a specialized network
component. The firm’s income statement for the past year is given below.
= $54,000 / $94,500 =
= $24,000 / $94,500 =
For 20X2, the input costs (COGS) will increase by $5 per unit. The elasticity of demand is most affected by the availability of
1. Calculate the gross margin and operating margin for Alfredo, Inc., for substitute products. In a competitive industry, the pricing decisions of
20X1.
other firms in the industry can affect the market shares of all firms in an
industry. A company that is the first to increase prices in response to
gross margin = gross profit / sales = $60,000 / $100,000 = 60%
operating margin = operating profit / sales = $30,000 / $100,000 = 30% increased costs will experience a greater decrease in unit sales than a
company that increases prices after other firms have already done so. A
For 20X2, the input costs (COGS) will increase by $5 per unit. firm may decide to delay increasing prices in order to gain market share
when other firms increase prices in response to increased costs. Firms
2. Calculate the 20X2 gross margin and operating margin assuming that: that are too quick to increase prices will experience declining sales
• Entire increase in input cost is passed on to the customers through an volumes, though firms that are slow to increase prices will experience
equal increase in selling price (units sold is not affected); declining gross margins.
• Selling price is increased by 5% and units sold decreases by 5%.
• Selling price is increased by 5% and units sold decreases by 10%. An analyst must also understand a company’s hedging activities and
vertical integration, if any, to guide assumptions about a subject
company’s response to increasing costs and the effect of price increase
on sales volume, total revenue, and profit margins.
As always, different business and geographic segments should be
considered separately when appropriate, and scenario and/or sensitivity
analysis should be conducted.
GM = $60,000 / $105,000 =
OM = $30,000 / $105,000 =