
Page 26 - FINAL CFA I SLIDES JUNE 2019 DAY 3
P. 26
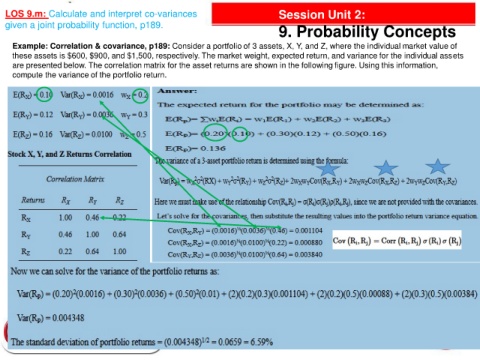
LOS 9.m: Calculate and interpret co-variances                                     Session Unit 2:
   given a joint probability function, p189.
                                                                                     9. Probability Concepts

     Example: Correlation & covariance, p189: Consider a portfolio of 3 assets, X, Y, and Z, where the individual market value of
     these assets is $600, $900, and $1,500, respectively. The market weight, expected return, and variance for the individual assets
     are presented below. The correlation matrix for the asset returns are shown in the following figure. Using this information,
     compute the variance of the portfolio return.