
Page 12 - AnnualEducationReport2018-19
P. 12
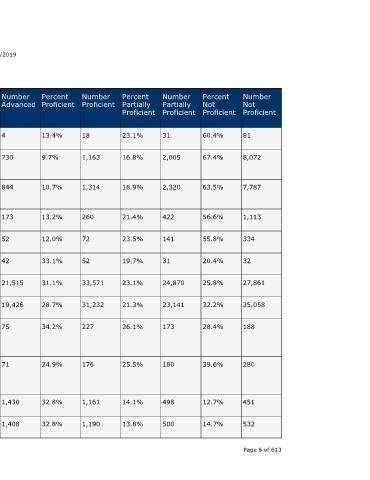
Number  Not  Proficient  81  8,072  7,787  1,113  334  32    27,861  35,058  188        280         451     532     Page 6 of 613


                                  Percent  Not  Proficient  60.4%  67.4%  63.5%  56.6%  55.8%  20.4%  25.8%  32.2%  28.4%  39.6%      12.7%   14.7%


                                  Number  Partially  Proficient  31  2,005  2,320  422  141  31  24,870  23,141  173      180         498     500


                                  Percent  Partially  Proficient  23.1%  16.8%  18.9%  21.4%  23.5%  19.7%  23.1%  21.3%  26.1%  25.5%  14.1%  13.8%


                                  Number  Proficient  18  1,163  1,314   260     72     52     33,571  31,232  227        176         1,161   1,190


                                  Percent  Proficient  13.4%  9.7%  10.7%  13.2%  12.0%  33.1%  31.1%  28.7%  34.2%       24.9%       32.8%   32.8%


                    04/10/2019    Number  Advanced  4  730      844      173     52     42     21,515  19,426  75         71          1,430   1,408


                                  Percent  Advanced  3.0%  6.1%  6.9%    8.8%    8.7%   26.8%  20.0%  17.8%   11.3%       10.0%       40.4%   38.8%


                                  State  Number  Students  Proficient  22  1,893  2,158  433  124  94  55,086  50,658  302  247       2,591   2,598


                                  State  Percent  Students  Proficient  16.4%  15.8%  17.6%  22.0%  20.7%  59.9%  51.1%  46.5%  45.6%  34.9%  73.2%  71.6%
                        Annual Education Report Statewide


                                  School  Year  2017-18  2016-17  2017-18  2017-18  2017-18  2017-18  2016-17  2017-18  2016-17  2017-18  2016-17  2017-18


                                  Testing  Group  Migrant  Students  With  Disabilities  Students  With  Disabilities  Homeless  Foster Care  Military  Connected  All  Students  All  Students  American  Indian or  Alaska  Native  American  Indian or  Alaska  Native  Asian  Asian A service of the Center for Educational Performance and Information (CEPI)


                             M-STEP Grades 3-11  Grade  Subject  4th Grade  ELA  Content  4th Grade  ELA  Content  4th Grade  ELA  Content  4th Grade  ELA  Content  4th Grade  ELA  Content  4th Grade  ELA  Content  5th Grade  ELA  Content  5th Grade  ELA  Content  5th Grade  ELA  Content  5th Grade  ELA  Content  5th Grade  ELA  Content  5th Grade  ELA  Content