
Page 13 - AnnualEducationReport2018-19
P. 13
04/10/2019 Number Percent Number Percent Number Percent Number Not Not Partially Partially Proficient Proficient Advanced Proficient Proficient Proficient Proficient 9,632 50.5% 4,724 24.7% 3,612 18.9% 1,122 11,183 58.2% 4,044 21.1% 3,070 16.0% 908 2,840 33.1% 2,353 27.4% 2,372 27.7% 1,008 3,591 40.1% 2,146 24.0% 2,295 25.6% 927 19 20.9% 18 19.8% 32 35.2% 22 24 26.4% 17 18.7% 32 35.2% 18 1,133 26.3% 1,102 25.6% 1,335 31.0% 743 1,546 34.2% 1,022 22.6% 1,249 27.6% 710 13,598 19.0% 16,002 22.4% 24,832 34.7% 17,115 17,902 25.0% 15,232 21
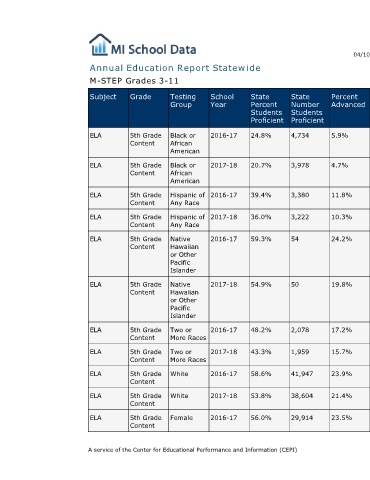
Percent Advanced 5.9% 4.7% 11.8% 10.3% 24.2% 19.8% 17.2% 15.7% 23.9% 21.4% 23.5%
State Number Students Proficient 4,734 3,978 3,380 3,222 54 50 2,078 1,959 41,947 38,604 29,914
State Percent Students Proficient 24.8% 20.7% 39.4% 36.0% 59.3% 54.9% 48.2% 43.3% 58.6% 53.8% 56.0%
Annual Education Report Statewide
School Year 2016-17 2017-18 2016-17 2017-18 2016-17 2017-18 2016-17 2017-18 2016-17 2017-18 2016-17
Testing Group Black or African American Black or African American Hispanic of Any Race Hispanic of Any Race Native Hawaiian or Other Pacific Islander Native Hawaiian or Other Pacific Islander Two or More Races Two or More Races White White Female A service of the Center for Educational Performance and Information (CEPI)
M-STEP Grades 3-11 Grade Subject 5th Grade ELA Content 5th Grade ELA Content 5th Grade ELA Content 5th Grade ELA Content 5th Grade ELA Content 5th Grade ELA Content 5th Grade ELA Content 5th Grade ELA Content 5th Grade ELA Content 5th Grade ELA Content 5th Grade ELA Content