
Page 15 - AnnualEducationReport2018-19
P. 15
04/10/2019 Number Percent Number Percent Number Percent Number Not Not Partially Partially Proficient Proficient Advanced Proficient Proficient Proficient Proficient 14,800 27.8% 11,485 21.5% 16,223 30.4% 10,815 16,327 30.0% 12,928 23.8% 16,183 29.7% 8,989 20,258 36.5% 11,656 21.0% 15,009 27.0% 8,611 20,628 38.2% 14,266 26.5% 14,001 26.0% 5,039 26,591 44.9% 13,791 23.3% 13,582 22.9% 5,234 3,328 46.1% 2,127 29.4% 1,421 19.7% 349 4,089 53.9% 1,920 25.3% 1,295 17.1% 281 53 46.9% 32 28.3% 21 18.6% 7 56 50.9% 33 30.0% 20 18.2% 1 7,223 60
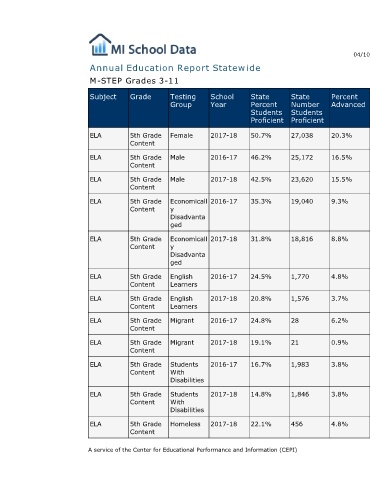
Percent Advanced 20.3% 16.5% 15.5% 9.3% 8.8% 4.8% 3.7% 6.2% 0.9% 3.8% 3.8% 4.8%
State Number Students Proficient 27,038 25,172 23,620 19,040 18,816 1,770 1,576 28 21 1,983 1,846 456
State Percent Students Proficient 50.7% 46.2% 42.5% 35.3% 31.8% 24.5% 20.8% 24.8% 19.1% 16.7% 14.8% 22.1%
Annual Education Report Statewide
School Year 2017-18 2016-17 2017-18 2016-17 2017-18 2016-17 2017-18 2016-17 2017-18 2016-17 2017-18 2017-18
Testing Group Female Male Male Economicall y Disadvanta ged Economicall y Disadvanta ged English Learners English Learners Migrant Migrant Students With Disabilities Students With Disabilities Homeless A service of the Center for Educational Performance and Information (CEPI)
M-STEP Grades 3-11 Grade Subject 5th Grade ELA Content 5th Grade ELA Content 5th Grade ELA Content 5th Grade ELA Content 5th Grade ELA Content 5th Grade ELA Content 5th Grade ELA Content 5th Grade ELA Content 5th Grade ELA Content 5th Grade ELA Content 5th Grade ELA Content 5th Grade ELA Content