
Page 16 - AnnualEducationReport2018-19
P. 16
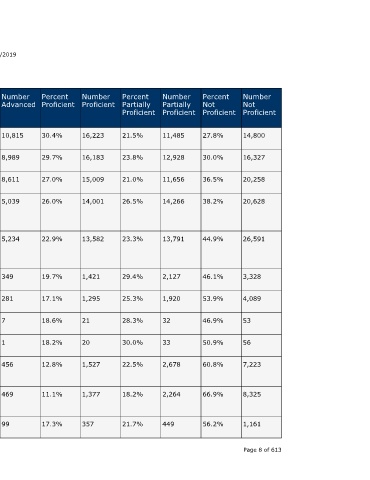
Number  Not  Proficient  14,800  16,327  20,258  20,628  26,591  3,328  4,089  53  56   7,223     8,325     1,161   Page 8 of 613


                                  Percent  Not  Proficient  27.8%  30.0%  36.5%  38.2%  44.9%  46.1%  53.9%  46.9%  50.9%  60.8%    66.9%     56.2%


                                  Number  Partially  Proficient  11,485  12,928  11,656  14,266  13,791  2,127  1,920  32  33  2,678  2,264   449


                                  Percent  Partially  Proficient  21.5%  23.8%  21.0%  26.5%  23.3%  29.4%  25.3%  28.3%  30.0%  22.5%  18.2%  21.7%


                                  Number  Proficient  16,223  16,183  15,009  14,001  13,582  1,421  1,295  21     20     1,527     1,377     357


                                  Percent  Proficient  30.4%  29.7%  27.0%  26.0%  22.9%     19.7%  17.1%   18.6%  18.2%  12.8%     11.1%     17.3%


                    04/10/2019    Number  Advanced  10,815  8,989  8,611  5,039  5,234       349    281     7      1      456       469       99


                                  Percent  Advanced  20.3%  16.5%  15.5%  9.3%   8.8%        4.8%   3.7%    6.2%   0.9%   3.8%      3.8%      4.8%


                                  State  Number  Students  Proficient  27,038  25,172  23,620  19,040  18,816  1,770  1,576  28  21  1,983  1,846  456


                                  State  Percent  Students  Proficient  50.7%  46.2%  42.5%  35.3%  31.8%  24.5%  20.8%  24.8%  19.1%  16.7%  14.8%  22.1%
                        Annual Education Report Statewide


                                  School  Year  2017-18  2016-17  2017-18  2016-17  2017-18  2016-17  2017-18  2016-17  2017-18  2016-17  2017-18  2017-18


                                  Testing  Group  Female  Male  Male  Economicall  y  Disadvanta  ged  Economicall  y  Disadvanta  ged  English  Learners  English  Learners  Migrant  Migrant  Students  With  Disabilities  Students  With  Disabilities  Homeless A service of the Center for Educational Performance and Information (CEPI)


                             M-STEP Grades 3-11  Grade  Subject  5th Grade  ELA  Content  5th Grade  ELA  Content  5th Grade  ELA  Content  5th Grade  ELA  Content  5th Grade  ELA  Content  5th Grade  ELA  Content  5th Grade  ELA  Content  5th Grade  ELA  Content  5th Grade  ELA  Content  5th Grade  ELA  Content  5th Grade  ELA  Content  5th Grade  ELA  Content