
Page 21 - AnnualEducationReport2018-19
P. 21
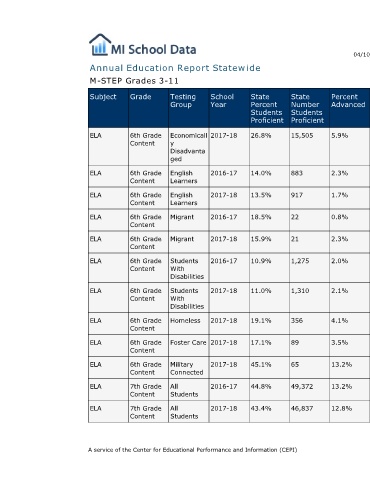
04/10/2019    Number  Percent Number  Percent Number  Percent Number  Not  Not Partially Partially Proficient Proficient Advanced  Proficient Proficient Proficient Proficient  25,690  44.5%  16,587  28.7%  12,094  20.9%  3,411  3,429  54.3%  2,002  31.7%  736  11.7%  147  3,941 58.1%  1,928 28.4%  800 11.8%  117  59  49.6%  38  31.9%  21  17.6%  1  76  57.6%  35  26.5%  18  13.6%  3  7,839  67.1%  2,570  22.0%  1,036  8.9%  239  8,099  68.0%  2,503  21.0%  1,065  8.9%  245  1,007  54.1%  497  26.7%  280  15.1%  76  306  58.7%  126  24.2%  71  13.6%  18  43  29.9%  36  25.0%  46  31.9%  19  31,877  29.0%
                                  Percent  Advanced  5.9%  2.3%   1.7%   0.8%    2.3%   2.0%      2.1%      4.1%   3.5%   13.2%  13.2%  12.8%


                                  State  Number  Students  Proficient  15,505  883  917  22  21  1,275  1,310  356  89    65     49,372  46,837


                                  State  Percent  Students  Proficient  26.8%  14.0%  13.5%  18.5%  15.9%  10.9%  11.0%  19.1%  17.1%  45.1%  44.8%  43.4%
                        Annual Education Report Statewide


                                  School  Year  2017-18    2016-17  2017-18  2016-17  2017-18  2016-17  2017-18  2017-18  2017-18  2017-18  2016-17  2017-18


                                  Testing  Group  Economicall  y  Disadvanta  ged  English  Learners  English  Learners  Migrant  Migrant  Students  With  Disabilities  Students  With  Disabilities  Homeless  Foster Care  Military  Connected  All  Students  All  Students A service of the Center for Educational Performance and Information (CEPI)

                             M-STEP Grades 3-11  Grade  Subject  6th Grade  ELA  Content  6th Grade  ELA  Content  6th Grade  ELA  Content  6th Grade  ELA  Content  6th Grade  ELA  Content  6th Grade  ELA  Content  6th Grade  ELA  Content  6th Grade  ELA  Content  6th Grade  ELA  Content  6th Grade  ELA  Content  7th Grade  ELA  Content  7th Grade  ELA  Content