
Page 22 - AnnualEducationReport2018-19
P. 22
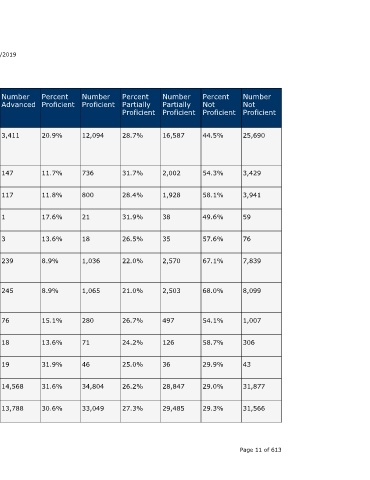
Number  Not  Proficient  25,690  3,429  3,941  59  76  7,839    8,099     1,007  306    43     31,877  31,566       Page 11 of 613


                                  Percent  Not  Proficient  44.5%  54.3%  58.1%  49.6%  57.6%  67.1%  68.0%  54.1%  58.7%  29.9%  29.0%  29.3%


                                  Number  Partially  Proficient  16,587  2,002  1,928  38  35  2,570  2,503  497   126    36     28,847  29,485


                                  Percent  Partially  Proficient  28.7%  31.7%  28.4%  31.9%  26.5%  22.0%  21.0%  26.7%  24.2%  25.0%  26.2%  27.3%


                                  Number  Proficient  12,094  736  800   21      18     1,036     1,065     280    71     46     34,804  33,049


                                  Percent  Proficient  20.9%  11.7%  11.8%  17.6%  13.6%  8.9%    8.9%      15.1%  13.6%  31.9%  31.6%  30.6%


                    04/10/2019    Number  Advanced  3,411  147    117    1       3      239       245       76     18     19     14,568  13,788


                                  Percent  Advanced  5.9%  2.3%   1.7%   0.8%    2.3%   2.0%      2.1%      4.1%   3.5%   13.2%  13.2%  12.8%


                                  State  Number  Students  Proficient  15,505  883  917  22  21  1,275  1,310  356  89    65     49,372  46,837


                                  State  Percent  Students  Proficient  26.8%  14.0%  13.5%  18.5%  15.9%  10.9%  11.0%  19.1%  17.1%  45.1%  44.8%  43.4%
                        Annual Education Report Statewide


                                  School  Year  2017-18    2016-17  2017-18  2016-17  2017-18  2016-17  2017-18  2017-18  2017-18  2017-18  2016-17  2017-18


                                  Testing  Group  Economicall  y  Disadvanta  ged  English  Learners  English  Learners  Migrant  Migrant  Students  With  Disabilities  Students  With  Disabilities  Homeless  Foster Care  Military  Connected  All  Students  All  Students A service of the Center for Educational Performance and Information (CEPI)


                             M-STEP Grades 3-11  Grade  Subject  6th Grade  ELA  Content  6th Grade  ELA  Content  6th Grade  ELA  Content  6th Grade  ELA  Content  6th Grade  ELA  Content  6th Grade  ELA  Content  6th Grade  ELA  Content  6th Grade  ELA  Content  6th Grade  ELA  Content  6th Grade  ELA  Content  7th Grade  ELA  Content  7th Grade  ELA  Content