
Page 27 - AnnualEducationReport2018-19
P. 27
04/10/2019 Number Percent Number Percent Number Percent Number Not Not Partially Partially Proficient Proficient Advanced Proficient Proficient Proficient Proficient 3,511 55.5% 1,811 28.7% 892 14.1% 107 3,621 56.9% 1,862 29.3% 769 12.1% 110 49 55.7% 26 29.5% 11 12.5% 2 53 51.0% 34 32.7% 15 14.4% 2 8,048 68.0% 2,535 21.4% 1,049 8.9% 199 7,878 66.7% 2,636 22.3% 1,089 9.2% 213 993 54.1% 450 24.5% 327 17.8% 65 271 56.3% 121 25.2% 76 15.8% 13 39 24.5% 34 21.4% 63 39.6% 23 25,496 23.4% 31,090 28.6% 38,014 34.9% 14,227 33,059 30.0% 3
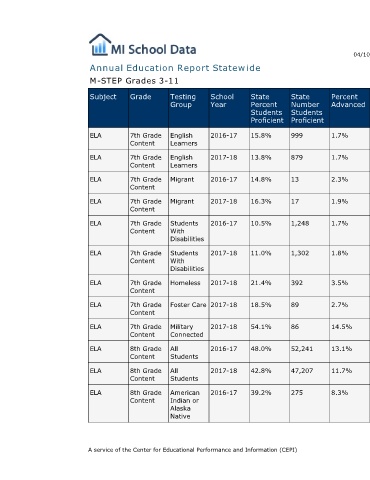
Percent Advanced 1.7% 1.7% 2.3% 1.9% 1.7% 1.8% 3.5% 2.7% 14.5% 13.1% 11.7% 8.3%
State Number Students Proficient 999 879 13 17 1,248 1,302 392 89 86 52,241 47,207 275
State Percent Students Proficient 15.8% 13.8% 14.8% 16.3% 10.5% 11.0% 21.4% 18.5% 54.1% 48.0% 42.8% 39.2%
Annual Education Report Statewide
School Year 2016-17 2017-18 2016-17 2017-18 2016-17 2017-18 2017-18 2017-18 2017-18 2016-17 2017-18 2016-17
Testing Group English Learners English Learners Migrant Migrant Students With Disabilities Students With Disabilities Homeless Foster Care Military Connected All Students All Students American Indian or Alaska Native A service of the Center for Educational Performance and Information (CEPI)
M-STEP Grades 3-11 Grade Subject 7th Grade ELA Content 7th Grade ELA Content 7th Grade ELA Content 7th Grade ELA Content 7th Grade ELA Content 7th Grade ELA Content 7th Grade ELA Content 7th Grade ELA Content 7th Grade ELA Content 8th Grade ELA Content 8th Grade ELA Content 8th Grade ELA Content