
Page 29 - AnnualEducationReport2018-19
P. 29
04/10/2019 Number Percent Number Percent Number Percent Number Not Not Partially Partially Proficient Proficient Advanced Proficient Proficient Proficient Proficient 286 38.9% 211 28.7% 200 27.2% 39 362 9.8% 641 17.3% 1,509 40.7% 1,197 471 12.4% 698 18.4% 1,503 39.6% 1,126 8,008 44.5% 5,661 31.5% 3,698 20.6% 618 9,601 52.5% 5,008 27.4% 3,110 17.0% 566 2,336 29.2% 2,706 33.9% 2,423 30.3% 525 3,099 37.2% 2,627 31.5% 2,093 25.1% 519 15 17.0% 20 22.7% 46 52.3% 7 25 27.2% 23 25.0% 29 31.5% 15 883 24.9% 1,045 29.5% 1,162 32.8% 456 Page
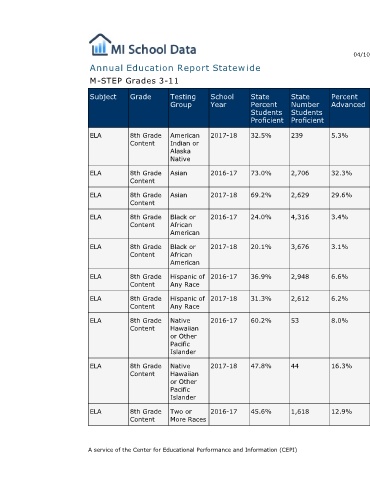
Percent Advanced 5.3% 32.3% 29.6% 3.4% 3.1% 6.6% 6.2% 8.0% 16.3% 12.9%
State Number Students Proficient 239 2,706 2,629 4,316 3,676 2,948 2,612 53 44 1,618
State Percent Students Proficient 32.5% 73.0% 69.2% 24.0% 20.1% 36.9% 31.3% 60.2% 47.8% 45.6%
Annual Education Report Statewide
School Year 2017-18 2016-17 2017-18 2016-17 2017-18 2016-17 2017-18 2016-17 2017-18 2016-17
Testing Group American Indian or Alaska Native Asian Asian Black or African American Black or African American Hispanic of Any Race Hispanic of Any Race Native Hawaiian or Other Pacific Islander Native Hawaiian or Other Pacific Islander Two or More Races A service of the Center for Educational Performance and Information (CEPI)
M-STEP Grades 3-11 Grade Subject 8th Grade ELA Content 8th Grade ELA Content 8th Grade ELA Content 8th Grade ELA Content 8th Grade ELA Content 8th Grade ELA Content 8th Grade ELA Content 8th Grade ELA Content 8th Grade ELA Content 8th Grade ELA Content