
Page 34 - AnnualEducationReport2018-19
P. 34
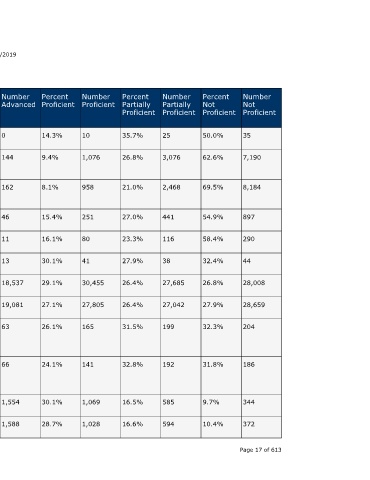
Number  Not  Proficient  35  7,190  8,184  897  290   44     28,008  28,659  204        186         344     372     Page 17 of 613


                                  Percent  Not  Proficient  50.0%  62.6%  69.5%  54.9%  58.4%  32.4%  26.8%  27.9%  32.3%  31.8%      9.7%    10.4%


                                  Number  Partially  Proficient  25  3,076  2,468  441  116  38  27,685  27,042  199      192         585     594


                                  Percent  Partially  Proficient  35.7%  26.8%  21.0%  27.0%  23.3%  27.9%  26.4%  26.4%  31.5%  32.8%  16.5%  16.6%


                                  Number  Proficient  10  1,076  958     251     80     41     30,455  27,805  165        141         1,069   1,028


                                  Percent  Proficient  14.3%  9.4%  8.1%  15.4%  16.1%  30.1%  29.1%  27.1%   26.1%       24.1%       30.1%   28.7%


                    04/10/2019    Number  Advanced  0  144      162      46      11     13     18,537  19,081  63         66          1,554   1,588


                                  Percent  Advanced  0.0%  1.3%  1.4%    2.8%    2.2%   9.6%   17.7%  18.6%   10.0%       11.3%       43.8%   44.3%


                                  State  Number  Students  Proficient  10  1,220  1,120  297  91  54  48,992  46,886  228  207        2,623   2,616


                                  State  Percent  Students  Proficient  14.3%  10.6%  9.5%  18.2%  18.3%  39.7%  46.8%  45.7%  36.1%  35.4%  73.8%  73.0%
                        Annual Education Report Statewide


                                  School  Year  2017-18  2016-17  2017-18  2017-18  2017-18  2017-18  2016-17  2017-18  2016-17  2017-18  2016-17  2017-18


                                  Testing  Group  Migrant  Students  With  Disabilities  Students  With  Disabilities  Homeless  Foster Care  Military  Connected  All  Students  All  Students  American  Indian or  Alaska  Native  American  Indian or  Alaska  Native  Asian  Asian A service of the Center for Educational Performance and Information (CEPI)


                             M-STEP Grades 3-11  Grade  Subject  8th Grade  ELA  Content  8th Grade  ELA  Content  8th Grade  ELA  Content  8th Grade  ELA  Content  8th Grade  ELA  Content  8th Grade  ELA  Content  3rd Grade Mathematic  Content  s  3rd Grade Mathematic  Content  s  3rd Grade Mathematic  Content  s  3rd Grade Mathematic  Content  s  3rd Grade Mathematic  Content  s  3rd Grade Mathematic  Content  s