
Page 39 - AnnualEducationReport2018-19
P. 39
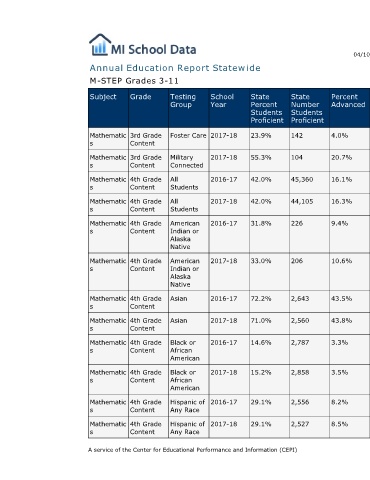
04/10/2019    Number  Percent Number  Percent Number  Percent Number  Not  Not Partially Partially Proficient Proficient Advanced  Proficient Proficient Proficient Proficient  304  51.1%  149  25.0%  118  19.8%  24  30  16.0%  54  28.7%  65  34.6%  39  26,539  24.6%  36,187  33.5%  27,914  25.8%  17,446  26,040  24.8%  34,968  33.3%  26,949  25.6%  17,156  185  26.0%  300  42.2%  159  22.4%  67  183  29.3%  235  37.7%  140  22.4%  66  341  9.3%  677  18.5%  1,049  28.7%  1,594  321  8.9%  727  20.1%  978  27.1%  1,582  9,938  52.2%  6,304  33.1%  2,162  11.4%  625  9,771  51.9%  6,196  32.9%  2,202  11.7%
                                  Percent  Advanced  4.0%  20.7%  16.1%  16.3%  9.4%    10.6%       43.5%   43.8%  3.3%      3.5%     8.2%    8.5%


                                  State  Number  Students  Proficient  142  104  45,360  44,105  226  206  2,643  2,560  2,787  2,858  2,556  2,527


                                  State  Percent  Students  Proficient  23.9%  55.3%  42.0%  42.0%  31.8%  33.0%  72.2%  71.0%  14.6%  15.2%  29.1%  29.1%
                        Annual Education Report Statewide


                                  School  Year  2017-18  2017-18  2016-17  2017-18  2016-17  2017-18  2016-17  2017-18  2016-17  2017-18  2016-17  2017-18


                                  Testing  Group  Foster Care  Military  Connected  All  Students  All  Students  American  Indian or  Alaska  Native  American  Indian or  Alaska  Native  Asian  Asian  Black or  African  American  Black or  African  American  Hispanic of  Any Race  Hispanic of  Any Race A service of the Center for Educational Performance and Information (CEPI)

                             M-STEP Grades 3-11  Grade  Subject  3rd Grade Mathematic  Content  s  3rd Grade Mathematic  Content  s  4th Grade Mathematic  Content  s  4th Grade Mathematic  Content  s  4th Grade Mathematic  Content  s  4th Grade Mathematic  Content  s  4th Grade Mathematic  Content  s  4th Grade Mathematic  Content  s  4th Grade Mathematic  Content  s  4th Grade Mathematic  Content  s  4th Grade Mathematic  Content  s  4th Grade Mathematic  Content  s