
Page 42 - AnnualEducationReport2018-19
P. 42
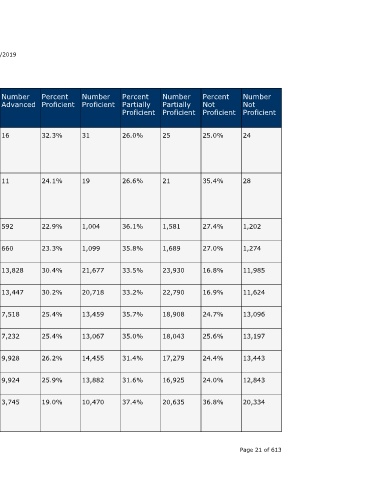
Number  Not  Proficient  24  28           1,202   1,274  11,985  11,624  13,096  13,197  13,443  12,843  20,334     Page 21 of 613


                                  Percent  Not  Proficient  25.0%  35.4%    27.4%   27.0%  16.8%  16.9%  24.7%   25.6%  24.4%  24.0%  36.8%


                                  Number  Partially  Proficient  25  21     1,581   1,689  23,930  22,790  18,908  18,043  17,279  16,925  20,635


                                  Percent  Partially  Proficient  26.0%  26.6%  36.1%  35.8%  33.5%  33.2%  35.7%  35.0%  31.4%  31.6%  37.4%


                                  Number  Proficient  31     19             1,004   1,099  21,677  20,718  13,459  13,067  14,455  13,882  10,470


                                  Percent  Proficient  32.3%  24.1%         22.9%   23.3%  30.4%  30.2%  25.4%   25.4%  26.2%  25.9%  19.0%


                    04/10/2019    Number  Advanced  16       11             592     660    13,828  13,447  7,518  7,232  9,928  9,924  3,745


                                  Percent  Advanced  16.7%   13.9%          13.5%   14.0%  19.4%  19.6%  14.2%   14.0%  18.0%  18.5%  6.8%


                                  State  Number  Students  Proficient  47  30  1,596  1,759  35,505  34,165  20,977  20,299  24,383  23,806  14,215


                                  State  Percent  Students  Proficient  49.0%  38.0%  36.4%  37.3%  49.7%  49.8%  39.6%  39.4%  44.2%  44.4%  25.8%
                        Annual Education Report Statewide


                                  School  Year  2016-17      2017-18        2016-17  2017-18  2016-17  2017-18  2016-17  2017-18  2016-17  2017-18  2016-17


                                  Testing  Group  Native  Hawaiian  or Other  Pacific  Islander  Native  Hawaiian  or Other  Pacific  Islander  Two or  More Races  Two or  More Races  White  White  Female  Female  Male  Male  Economicall  y  Disadvanta  ged A service of the Center for Educational Performance and Information (CEPI)


                             M-STEP Grades 3-11  Grade  Subject  4th Grade Mathematic  Content  s  4th Grade Mathematic  Content  s  4th Grade Mathematic  Content  s  4th Grade Mathematic  Content  s  4th Grade Mathematic  Content  s  4th Grade Mathematic  Content  s  4th Grade Mathematic  Content  s  4th Grade Mathematic  Content  s  4th Grade Mathematic  Content  s  4th Grade Mathematic  Content  s  4th Grade Mathematic  Content  s