
Page 46 - AnnualEducationReport2018-19
P. 46
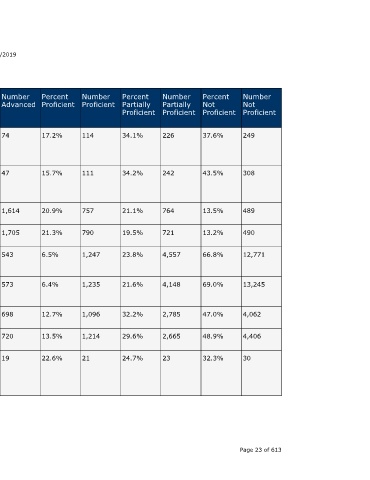
Number  Not  Proficient  249  308    489     490    12,771    13,245   4,062   4,406  30                            Page 23 of 613


                                  Percent  Not  Proficient  37.6%  43.5%  13.5%  13.2%  66.8%   69.0%    47.0%   48.9%  32.3%


                                  Number  Partially  Proficient  226  242  764  721   4,557     4,148    2,785   2,665  23


                                  Percent  Partially  Proficient  34.1%  34.2%  21.1%  19.5%  23.8%  21.6%  32.2%  29.6%  24.7%


                                  Number  Proficient  114  111         757     790    1,247     1,235    1,096   1,214  21


                                  Percent  Proficient  17.2%  15.7%    20.9%   21.3%  6.5%      6.4%     12.7%   13.5%  22.6%


                    04/10/2019    Number  Advanced  74     47          1,614   1,705  543       573      698     720    19


                                  Percent  Advanced  11.2%  6.6%       44.5%   46.0%  2.8%      3.0%     8.1%    8.0%   20.4%


                                  State  Number  Students  Proficient  188  158  2,371  2,495  1,790  1,808  1,794  1,934  40


                                  State  Percent  Students  Proficient  28.4%  22.3%  65.4%  67.3%  9.4%  9.4%  20.8%  21.5%  43.0%
                        Annual Education Report Statewide


                                  School  Year  2016-17    2017-18     2016-17  2017-18  2016-17  2017-18  2016-17  2017-18  2016-17


                                  Testing  Group  American  Indian or  Alaska  Native  American  Indian or  Alaska  Native  Asian  Asian  Black or  African  American  Black or  African  American  Hispanic of  Any Race  Hispanic of  Any Race  Native  Hawaiian  or Other  Pacific  Islander  A service of the Center for Educational Performance and Information (CEPI)


                             M-STEP Grades 3-11  Grade  Subject  5th Grade Mathematic  Content  s  5th Grade Mathematic  Content  s  5th Grade Mathematic  Content  s  5th Grade Mathematic  Content  s  5th Grade Mathematic  Content  s  5th Grade Mathematic  Content  s  5th Grade Mathematic  Content  s  5th Grade Mathematic  Content  s  5th Grade Mathematic  Content  s