
Page 44 - AnnualEducationReport2018-19
P. 44
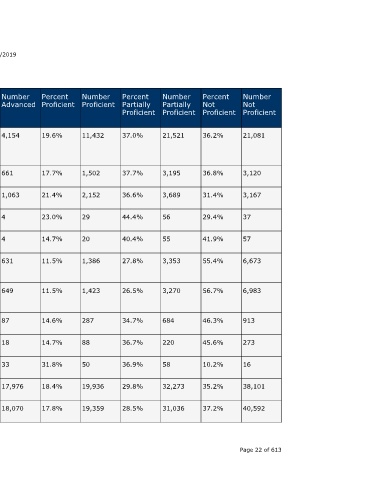
Number  Not  Proficient  21,081  3,120  3,167  37  57  6,673    6,983     913    273    16     38,101  40,592       Page 22 of 613


                                  Percent  Not  Proficient  36.2%  36.8%  31.4%  29.4%  41.9%  55.4%  56.7%  46.3%  45.6%  10.2%  35.2%  37.2%


                                  Number  Partially  Proficient  21,521  3,195  3,689  56  55  3,353  3,270  684   220    58     32,273  31,036


                                  Percent  Partially  Proficient  37.0%  37.7%  36.6%  44.4%  40.4%  27.8%  26.5%  34.7%  36.7%  36.9%  29.8%  28.5%


                                  Number  Proficient  11,432  1,502  2,152  29   20     1,386     1,423     287    88     50     19,936  19,359


                                  Percent  Proficient  19.6%  17.7%  21.4%  23.0%  14.7%  11.5%   11.5%     14.6%  14.7%  31.8%  18.4%  17.8%


                    04/10/2019    Number  Advanced  4,154  661    1,063  4       4      631       649       87     18     33     17,976  18,070


                                  Percent  Advanced  7.1%  7.8%   10.6%  3.2%    2.9%   5.2%      5.3%      4.4%   3.0%   21.0%  16.6%  16.6%


                                  State  Number  Students  Proficient  15,586  2,163  3,215  33  24  2,017  2,072  374  106  83  37,912  37,429


                                  State  Percent  Students  Proficient  26.8%  25.5%  31.9%  26.2%  17.6%  16.7%  16.8%  19.0%  17.7%  52.9%  35.0%  34.3%
                        Annual Education Report Statewide


                                  School  Year  2017-18    2016-17  2017-18  2016-17  2017-18  2016-17  2017-18  2017-18  2017-18  2017-18  2016-17  2017-18


                                  Testing  Group  Economicall  y  Disadvanta  ged  English  Learners  English  Learners  Migrant  Migrant  Students  With  Disabilities  Students  With  Disabilities  Homeless  Foster Care  Military  Connected  All  Students  All  Students A service of the Center for Educational Performance and Information (CEPI)


                             M-STEP Grades 3-11  Grade  Subject  4th Grade Mathematic  Content  s  4th Grade Mathematic  Content  s  4th Grade Mathematic  Content  s  4th Grade Mathematic  Content  s  4th Grade Mathematic  Content  s  4th Grade Mathematic  Content  s  4th Grade Mathematic  Content  s  4th Grade Mathematic  Content  s  4th Grade Mathematic  Content  s  4th Grade Mathematic  Content  s  5th Grade Mathematic  Content  s  5th Grade Mathematic  Content  s