
Page 50 - AnnualEducationReport2018-19
P. 50
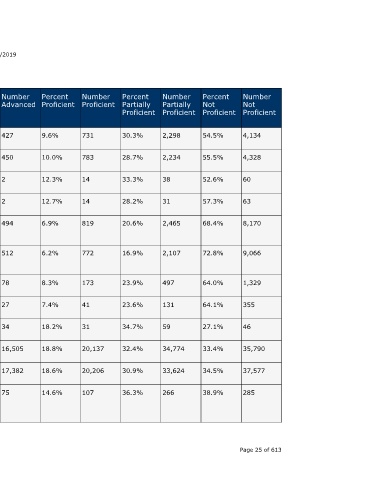
Number  Not  Proficient  4,134  4,328  60  63  8,170  9,066  1,329  355     46     35,790  37,577  285              Page 25 of 613


                                  Percent  Not  Proficient  54.5%  55.5%  52.6%  57.3%  68.4%  72.8%  64.0%  64.1%  27.1%  33.4%  34.5%  38.9%


                                  Number  Partially  Proficient  2,298  2,234  38  31  2,465  2,107  497  131  59    34,774  33,624  266


                                  Percent  Partially  Proficient  30.3%  28.7%  33.3%  28.2%  20.6%  16.9%  23.9%  23.6%  34.7%  32.4%  30.9%  36.3%


                                  Number  Proficient  731  783  14  14     819       772       173    41      31     20,137  20,206  107


                                  Percent  Proficient  9.6%  10.0%  12.3%  12.7%  6.9%  6.2%   8.3%   7.4%    18.2%  18.8%  18.6%  14.6%


                    04/10/2019    Number  Advanced  427  450  2     2      494       512       78     27      34     16,505  17,382  75


                                  Percent  Advanced  5.6%  5.8%  1.8%  1.8%  4.1%    4.1%      3.8%   4.9%    20.0%  15.4%  16.0%  10.2%


                                  State  Number  Students  Proficient  1,158  1,233  16  16  1,313  1,284  251  68  65  36,642  37,588  182


                                  State  Percent  Students  Proficient  15.3%  15.8%  14.0%  14.5%  11.0%  10.3%  12.1%  12.3%  38.2%  34.2%  34.6%  24.8%
                        Annual Education Report Statewide


                                  School  Year  2016-17  2017-18  2016-17  2017-18  2016-17  2017-18  2017-18  2017-18  2017-18  2016-17  2017-18  2016-17


                                  Testing  Group  English  Learners  English  Learners  Migrant  Migrant  Students  With  Disabilities  Students  With  Disabilities  Homeless  Foster Care  Military  Connected  All  Students  All  Students  American  Indian or  Alaska  Native A service of the Center for Educational Performance and Information (CEPI)


                             M-STEP Grades 3-11  Grade  Subject  5th Grade Mathematic  Content  s  5th Grade Mathematic  Content  s  5th Grade Mathematic  Content  s  5th Grade Mathematic  Content  s  5th Grade Mathematic  Content  s  5th Grade Mathematic  Content  s  5th Grade Mathematic  Content  s  5th Grade Mathematic  Content  s  5th Grade Mathematic  Content  s  6th Grade Mathematic  Content  s  6th Grade Mathematic  Content  s  6th Grade Mathematic  Content  s