
Page 37 - AnnualEducationReport2018-19
P. 37
04/10/2019 Number Percent Number Percent Number Percent Number Not Not Partially Partially Proficient Proficient Advanced Proficient Proficient Proficient Proficient 14,540 28.9% 13,882 27.6% 13,449 26.7% 8,446 13,856 25.9% 13,680 25.6% 15,682 29.3% 10,257 14,119 27.0% 13,160 25.2% 14,356 27.5% 10,635 21,207 39.0% 16,083 29.5% 12,795 23.5% 4,345 22,948 39.7% 16,907 29.2% 12,751 22.0% 5,266 3,327 30.2% 3,086 28.1% 2,964 26.9% 1,624 3,288 31.6% 3,048 29.3% 2,574 24.8% 1,487 59 41.5% 52 36.6% 23 16.2% 8 65 48.1% 39 28.9% 25 18.5% 6 6,16
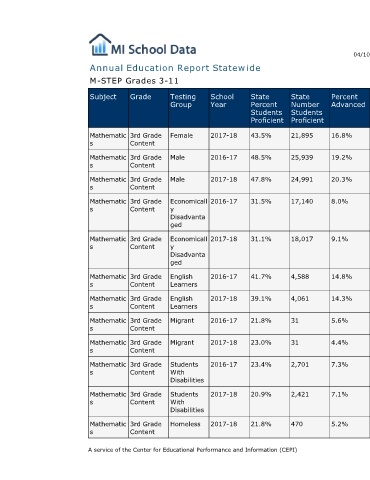
Percent Advanced 16.8% 19.2% 20.3% 8.0% 9.1% 14.8% 14.3% 5.6% 4.4% 7.3% 7.1% 5.2%
State Number Students Proficient 21,895 25,939 24,991 17,140 18,017 4,588 4,061 31 31 2,701 2,421 470
State Percent Students Proficient 43.5% 48.5% 47.8% 31.5% 31.1% 41.7% 39.1% 21.8% 23.0% 23.4% 20.9% 21.8%
Annual Education Report Statewide
School Year 2017-18 2016-17 2017-18 2016-17 2017-18 2016-17 2017-18 2016-17 2017-18 2016-17 2017-18 2017-18
Testing Group Female Male Male Economicall y Disadvanta ged Economicall y Disadvanta ged English Learners English Learners Migrant Migrant Students With Disabilities Students With Disabilities Homeless A service of the Center for Educational Performance and Information (CEPI)
M-STEP Grades 3-11 Grade Subject 3rd Grade Mathematic Content s 3rd Grade Mathematic Content s 3rd Grade Mathematic Content s 3rd Grade Mathematic Content s 3rd Grade Mathematic Content s 3rd Grade Mathematic Content s 3rd Grade Mathematic Content s 3rd Grade Mathematic Content s 3rd Grade Mathematic Content s 3rd Grade Mathematic Content s 3rd Grade Mathematic Content s 3rd Grade Mathematic Content s