
Page 36 - AnnualEducationReport2018-19
P. 36
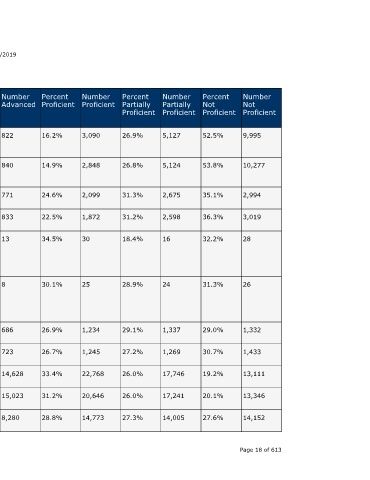
Number  Not  Proficient  9,995  10,277  2,994  3,019  28      26             1,332  1,433  13,111  13,346  14,152   Page 18 of 613


                                  Percent  Not  Proficient  52.5%  53.8%  35.1%  36.3%  32.2%   31.3%          29.0%  30.7%  19.2%  20.1%   27.6%


                                  Number  Partially  Proficient  5,127  5,124  2,675  2,598  16  24            1,337  1,269  17,746  17,241  14,005


                                  Percent  Partially  Proficient  26.9%  26.8%  31.3%  31.2%  18.4%  28.9%     29.1%  27.2%  26.0%  26.0%   27.3%


                                  Number  Proficient  3,090  2,848  2,099  1,872  30            25             1,234  1,245  22,768  20,646  14,773


                                  Percent  Proficient  16.2%  14.9%  24.6%  22.5%  34.5%        30.1%          26.9%  26.7%  33.4%  31.2%   28.8%


                    04/10/2019    Number  Advanced  822  840      771    833     13             8              686    723    14,628  15,023  8,280


                                  Percent  Advanced  4.3%  4.4%   9.0%   10.0%   14.9%          9.6%           14.9%  15.5%  21.4%  22.7%   16.2%


                                  State  Number  Students  Proficient  3,912  3,688  2,870  2,705  43  33      1,920  1,968  37,396  35,669  23,053


                                  State  Percent  Students  Proficient  20.6%  19.3%  33.6%  32.5%  49.4%  39.8%  41.8%  42.1%  54.8%  53.8%  45.0%
                        Annual Education Report Statewide


                                  School  Year  2016-17  2017-18  2016-17  2017-18  2016-17     2017-18        2016-17  2017-18  2016-17  2017-18  2016-17


                                  Testing  Group  Black or  African  American  Black or  African  American  Hispanic of  Any Race  Hispanic of  Any Race  Native  Hawaiian  or Other  Pacific  Islander  Native  Hawaiian  or Other  Pacific  Islander  Two or  More Races  Two or  More Races  White  White  Female A service of the Center for Educational Performance and Information (CEPI)


                             M-STEP Grades 3-11  Grade  Subject  3rd Grade Mathematic  Content  s  3rd Grade Mathematic  Content  s  3rd Grade Mathematic  Content  s  3rd Grade Mathematic  Content  s  3rd Grade Mathematic  Content  s  3rd Grade Mathematic  Content  s  3rd Grade Mathematic  Content  s  3rd Grade Mathematic  Content  s  3rd Grade Mathematic  Content  s  3rd Grade Mathematic  Content  s  3rd Grade Mathematic  Content  s