
Page 32 - AnnualEducationReport2018-19
P. 32
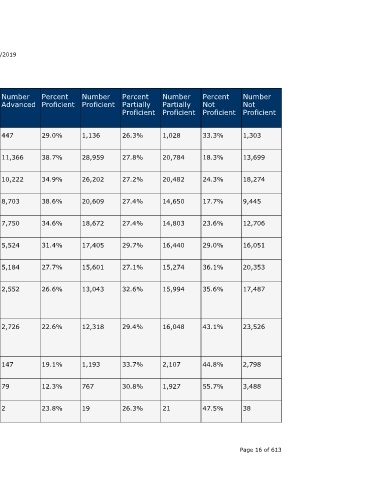
Number  Not  Proficient  1,303  13,699  18,274  9,445  12,706  16,051  20,353  17,487  23,526  2,798  3,488  38     Page 16 of 613


                                  Percent  Not  Proficient  33.3%  18.3%  24.3%  17.7%  23.6%  29.0%  36.1%  35.6%  43.1%  44.8%  55.7%  47.5%


                                  Number  Partially  Proficient  1,028  20,784  20,482  14,650  14,803  16,440  15,274  15,994  16,048  2,107  1,927  21


                                  Percent  Partially  Proficient  26.3%  27.8%  27.2%  27.4%  27.4%  29.7%  27.1%  32.6%  29.4%  33.7%  30.8%  26.3%


                                  Number  Proficient  1,136  28,959  26,202  20,609  18,672  17,405  15,601  13,043  12,318  1,193  767  19


                                  Percent  Proficient  29.0%  38.7%  34.9%  38.6%  34.6%  31.4%  27.7%  26.6%  22.6%      19.1%  12.3%  23.8%


                    04/10/2019    Number  Advanced  447  11,366  10,222  8,703  7,750  5,524  5,184  2,552    2,726       147    79     2


                                  Percent  Advanced  11.4%  15.2%  13.6%  16.3%  14.4%  10.0%  9.2%  5.2%     5.0%        2.4%   1.3%   2.5%


                                  State  Number  Students  Proficient  1,583  40,325  36,424  29,312  26,422  22,929  20,785  15,595  15,044  1,340  846  21


                                  State  Percent  Students  Proficient  40.4%  53.9%  48.4%  54.9%  49.0%  41.4%  36.8%  31.8%  27.5%  21.5%  13.5%  26.3%
                        Annual Education Report Statewide


                                  School  Year  2017-18  2016-17  2017-18  2016-17  2017-18  2016-17  2017-18  2016-17  2017-18  2016-17  2017-18  2016-17


                                  Testing  Group  Two or  More Races  White  White  Female  Female  Male  Male  Economicall  y  Disadvanta  ged  Economicall  y  Disadvanta  ged  English  Learners  English  Learners  Migrant  A service of the Center for Educational Performance and Information (CEPI)


                             M-STEP Grades 3-11  Grade  Subject  8th Grade  ELA  Content  8th Grade  ELA  Content  8th Grade  ELA  Content  8th Grade  ELA  Content  8th Grade  ELA  Content  8th Grade  ELA  Content  8th Grade  ELA  Content  8th Grade  ELA  Content  8th Grade  ELA  Content  8th Grade  ELA  Content  8th Grade  ELA  Content  8th Grade  ELA  Content