
Page 25 - AnnualEducationReport2018-19
P. 25
04/10/2019 Number Percent Number Percent Number Percent Number Not Not Partially Partially Proficient Proficient Advanced Proficient Proficient Proficient Proficient 19 27.9% 19 27.9% 24 35.3% 6 1,211 31.3% 1,002 25.9% 1,153 29.8% 502 1,263 31.8% 1,092 27.5% 1,140 28.7% 475 17,052 22.7% 19,651 26.2% 26,672 35.6% 11,604 16,661 23.1% 19,587 27.1% 25,098 34.8% 10,831 12,362 23.0% 14,044 26.1% 18,911 35.2% 8,467 12,194 23.0% 14,812 28.0% 18,024 34.0% 7,921 19,515 34.7% 14,803 26.3% 15,893 28.2% 6,101 19,372 35.3% 14,673 26.7% 15,025 27.3% 5,
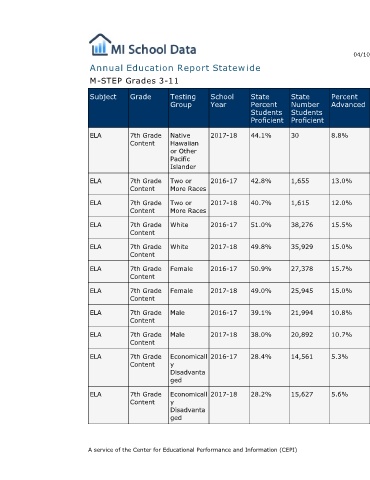
Percent Advanced 8.8% 13.0% 12.0% 15.5% 15.0% 15.7% 15.0% 10.8% 10.7% 5.3% 5.6%
State Number Students Proficient 30 1,655 1,615 38,276 35,929 27,378 25,945 21,994 20,892 14,561 15,627
State Percent Students Proficient 44.1% 42.8% 40.7% 51.0% 49.8% 50.9% 49.0% 39.1% 38.0% 28.4% 28.2%
Annual Education Report Statewide
School Year 2017-18 2016-17 2017-18 2016-17 2017-18 2016-17 2017-18 2016-17 2017-18 2016-17 2017-18
Testing Group Native Hawaiian or Other Pacific Islander Two or More Races Two or More Races White White Female Female Male Male Economicall y Disadvanta ged Economicall y Disadvanta ged A service of the Center for Educational Performance and Information (CEPI)
M-STEP Grades 3-11 Grade Subject 7th Grade ELA Content 7th Grade ELA Content 7th Grade ELA Content 7th Grade ELA Content 7th Grade ELA Content 7th Grade ELA Content 7th Grade ELA Content 7th Grade ELA Content 7th Grade ELA Content 7th Grade ELA Content 7th Grade ELA Content