
Page 19 - AnnualEducationReport2018-19
P. 19
04/10/2019 Number Percent Number Percent Number Percent Number Not Not Partially Partially Proficient Proficient Advanced Proficient Proficient Proficient Proficient 23 32.4% 18 25.4% 19 26.8% 11 20 22.0% 28 30.8% 30 33.0% 13 1,217 30.9% 1,128 28.7% 1,055 26.8% 533 1,452 32.8% 1,287 29.1% 1,154 26.1% 535 16,479 23.0% 19,119 26.7% 23,454 32.7% 12,591 17,772 24.7% 19,697 27.3% 23,207 32.2% 11,372 12,706 24.2% 14,225 27.1% 16,147 30.8% 9,393 14,186 26.4% 14,974 27.9% 16,137 30.1% 8,373 18,816 34.5% 14,591 26.8% 14,763 27.1% 6,369 19,950 36.3%
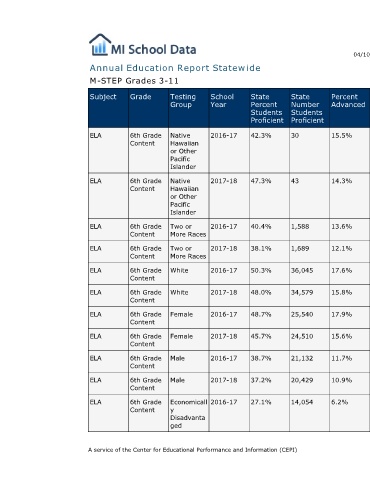
Percent Advanced 15.5% 14.3% 13.6% 12.1% 17.6% 15.8% 17.9% 15.6% 11.7% 10.9% 6.2%
State Number Students Proficient 30 43 1,588 1,689 36,045 34,579 25,540 24,510 21,132 20,429 14,054
State Percent Students Proficient 42.3% 47.3% 40.4% 38.1% 50.3% 48.0% 48.7% 45.7% 38.7% 37.2% 27.1%
Annual Education Report Statewide
School Year 2016-17 2017-18 2016-17 2017-18 2016-17 2017-18 2016-17 2017-18 2016-17 2017-18 2016-17
Testing Group Native Hawaiian or Other Pacific Islander Native Hawaiian or Other Pacific Islander Two or More Races Two or More Races White White Female Female Male Male Economicall y Disadvanta ged A service of the Center for Educational Performance and Information (CEPI)
M-STEP Grades 3-11 Grade Subject 6th Grade ELA Content 6th Grade ELA Content 6th Grade ELA Content 6th Grade ELA Content 6th Grade ELA Content 6th Grade ELA Content 6th Grade ELA Content 6th Grade ELA Content 6th Grade ELA Content 6th Grade ELA Content 6th Grade ELA Content