
Page 18 - AnnualEducationReport2018-19
P. 18
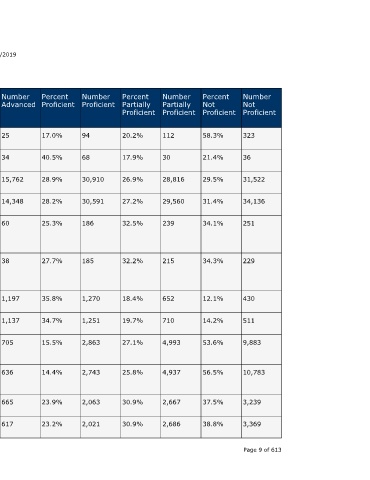
Number  Not  Proficient  323  36  31,522  34,136  251  229        430     511    9,883     10,783   3,239   3,369   Page 9 of 613


                                  Percent  Not  Proficient  58.3%  21.4%  29.5%  31.4%  34.1%  34.3%  12.1%  14.2%  53.6%    56.5%    37.5%   38.8%


                                  Number  Partially  Proficient  112  30  28,816  29,560  239  215  652     710    4,993     4,937    2,667   2,686


                                  Percent  Partially  Proficient  20.2%  17.9%  26.9%  27.2%  32.5%  32.2%  18.4%  19.7%  27.1%  25.8%  30.9%  30.9%


                                  Number  Proficient  94  68  30,910  30,591  186       185         1,270   1,251  2,863     2,743    2,063   2,021


                                  Percent  Proficient  17.0%  40.5%  28.9%  28.2%  25.3%  27.7%     35.8%   34.7%  15.5%     14.4%    23.9%   23.2%


                    04/10/2019    Number  Advanced  25  34   15,762  14,348  60         38          1,197   1,137  705       636      665     617


                                  Percent  Advanced  4.5%  20.2%  14.7%  13.2%  8.2%    5.7%        33.7%   31.5%  3.8%      3.3%     7.7%    7.1%


                                  State  Number  Students  Proficient  119  102  46,672  44,939  246  223  2,467  2,388  3,568  3,379  2,728  2,638


                                  State  Percent  Students  Proficient  21.5%  60.7%  43.6%  41.4%  33.4%  33.4%  69.5%  66.2%  19.3%  17.7%  31.6%  30.3%
                        Annual Education Report Statewide


                                  School  Year  2017-18  2017-18  2016-17  2017-18  2016-17  2017-18  2016-17  2017-18  2016-17  2017-18  2016-17  2017-18


                                  Testing  Group  Foster Care  Military  Connected  All  Students  All  Students  American  Indian or  Alaska  Native  American  Indian or  Alaska  Native  Asian  Asian  Black or  African  American  Black or  African  American  Hispanic of  Any Race  Hispanic of  Any Race A service of the Center for Educational Performance and Information (CEPI)


                             M-STEP Grades 3-11  Grade  Subject  5th Grade  ELA  Content  5th Grade  ELA  Content  6th Grade  ELA  Content  6th Grade  ELA  Content  6th Grade  ELA  Content  6th Grade  ELA  Content  6th Grade  ELA  Content  6th Grade  ELA  Content  6th Grade  ELA  Content  6th Grade  ELA  Content  6th Grade  ELA  Content  6th Grade  ELA  Content