Page 1 - Bay_County_Townhouses_and_Condos_2017-Q2_Detail_Neat
P. 1

Quarterly Market Detail - Q2 2017
        Townhouses and Condos

        Bay County


                                                                                                             Percent Change
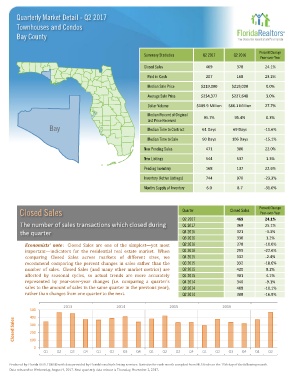
                                                             Summary Statistics       Q2 2017      Q2 2016
                                                                                                              Year-over-Year
                                                             Closed Sales              469          378         24.1%

                                                               Paid in Cash            207          168         23.2%
                                                               Median Sale Price     $219,000     $219,000      0.0%

                                                               Average Sale Price    $234,377     $227,648      3.0%
                                                               Dollar Volume       $109.9 Million  $86.1 Million  27.7%

                                                               Median Percent of Original
                                                                                      95.7%        95.4%        0.3%
                                                               List Price Received
                                                               Median Time to Contract  61 Days   69 Days      -11.6%

                                                               Median Time to Sale    90 Days     106 Days     -15.1%
                                                             New Pending Sales         471          386         22.0%

                                                             New Listings              544          537         1.3%

                                                             Pending Inventory         168          137         22.6%
                                                             Inventory (Active Listings)  744       970        -23.3%
                                                             Months Supply of Inventory  6.0        8.7        -31.0%


                                                                                                             Percent Change
         Closed Sales                                                        Quarter             Closed Sales  Year-over-Year
                                                                             Q2 2017                469         24.1%
         The number of sales transactions which closed during                Q1 2017                369         25.1%
         the quarter                                                         Q4 2016                321         -3.3%
                                                                             Q3 2016                336         1.2%
            Economists' note : Closed Sales are one of the simplest—yet most  Q2 2016               378        -10.0%
            important—indicators for the residential real estate market. When  Q1 2016              295        -22.6%
            comparing Closed Sales across markets of different sizes, we     Q4 2015                332         -2.4%
            recommend comparing the percent changes in sales rather than the  Q3 2015               332        -18.6%
            number of sales. Closed Sales (and many other market metrics) are  Q2 2015              420         8.2%
            affected by seasonal cycles, so actual trends are more accurately  Q1 2015              381         4.1%
            represented by year-over-year changes (i.e. comparing a quarter's  Q4 2014              340         -9.1%
            sales to the amount of sales in the same quarter in the previous year),  Q3 2014        408        -10.1%
            rather than changes from one quarter to the next.                Q2 2014                388        -16.9%

                            2013                  2014                  2015                  2016
              500
              400
       Closed Sales  300

              200
              100
               0
                   Q1    Q2   Q3    Q4   Q1    Q2   Q3    Q4   Q1    Q2   Q3    Q4    Q1   Q2    Q3   Q4    Q1   Q2

     Produced by Florida REALTORS® with data provided by Florida's multiple listing services. Statistics for each month compiled from MLS feeds on the 15th day of the following month.
     Data released on Wednesday, August 9, 2017. Next quarterly data release is Thursday, November 2, 2017.
   1   2   3   4   5   6