
Page 6 - Bay_County_Townhouses_and_Condos_2017-Q2_Detail_Neat
P. 6
Quarterly Market Detail - Q2 2017
Townhouses and Condos
Bay County
Percent Change
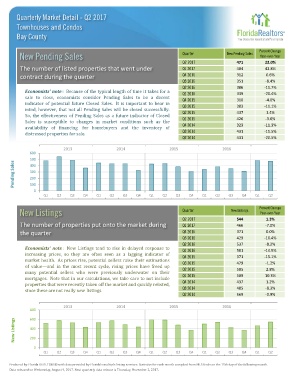
New Pending Sales
New Pending Sales Quarter Year-over-Year
Q2 2017 471 22.0%
The number of listed properties that went under Q1 2017 484 42.8%
contract during the quarter Q4 2016 312 0.6%
Q3 2016 351 -8.4%
Q2 2016 386 -11.7%
Economists' note : Because of the typical length of time it takes for a Q1 2016 339 -20.4%
sale to close, economists consider Pending Sales to be a decent
indicator of potential future Closed Sales. It is important to bear in Q4 2015 310 -4.0%
mind, however, that not all Pending Sales will be closed successfully. Q3 2015 383 -11.1%
So, the effectiveness of Pending Sales as a future indicator of Closed Q2 2015 437 1.4%
Sales is susceptible to changes in market conditions such as the Q1 2015 426 -3.6%
availability of financing for homebuyers and the inventory of Q4 2014 323 -11.3%
distressed properties for sale. Q3 2014 431 -11.5%
Q2 2014 431 -20.5%
2013 2014 2015 2016
600
500
Pending Sales 300
400
200
100
0
Q1 Q2 Q3 Q4 Q1 Q2 Q3 Q4 Q1 Q2 Q3 Q4 Q1 Q2 Q3 Q4 Q1 Q2
Percent Change
New Listings Quarter New Listings Year-over-Year
Q2 2017 544 1.3%
The number of properties put onto the market during Q1 2017 466 -7.0%
the quarter Q4 2016 371 0.0%
Q3 2016 429 -10.4%
Q2 2016 537 -8.2%
Economists' note : New Listings tend to rise in delayed response to Q1 2016 501 -14.9%
increasing prices, so they are often seen as a lagging indicator of
market health. As prices rise, potential sellers raise their estimations Q4 2015 371 -15.1%
of value—and in the most recent cycle, rising prices have freed up Q3 2015 479 -1.2%
many potential sellers who were previously underwater on their Q2 2015 585 2.8%
mortgages. Note that in our calculations, we take care to not include Q1 2015 589 10.3%
properties that were recently taken off the market and quickly relisted, Q4 2014 437 1.2%
since these are not really new listings. Q3 2014 485 -8.3%
Q2 2014 569 -0.9%
2013 2014 2015 2016
800
New Listings 400
600
200
0
Q1 Q2 Q3 Q4 Q1 Q2 Q3 Q4 Q1 Q2 Q3 Q4 Q1 Q2 Q3 Q4 Q1 Q2
Produced by Florida REALTORS® with data provided by Florida's multiple listing services. Statistics for each month compiled from MLS feeds on the 15th day of the following month.
Data released on Wednesday, August 9, 2017. Next quarterly data release is Thursday, November 2, 2017.