Page 2 - Bay_County_Townhouses_and_Condos_2017-Q2_Detail_Neat
P. 2

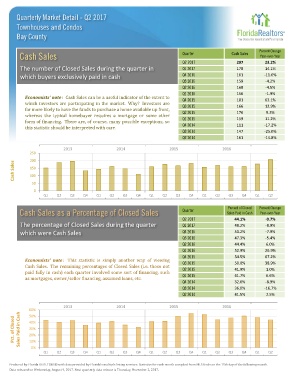
Quarterly Market Detail - Q2 2017
        Townhouses and Condos

        Bay County


                                                                                                             Percent Change
         Cash Sales                                                          Quarter              Cash Sales  Year-over-Year
                                                                             Q2 2017                207         23.2%
         The number of Closed Sales during the quarter in                    Q1 2017                178         14.1%
         which buyers exclusively paid in cash                               Q4 2016                161        -11.0%
                                                                             Q3 2016                159         -4.2%
                                                                             Q2 2016                168         -4.5%
                                                                             Q1 2016                156         -1.9%
            Economists' note : Cash Sales can be a useful indicator of the extent to
            which investors are participating in the market. Why? Investors are  Q4 2015            181         63.1%
            far more likely to have the funds to purchase a home available up front,  Q3 2015       166         12.9%
            whereas the typical homebuyer requires a mortgage or some other  Q2 2015                176         9.3%
            form of financing. There are, of course, many possible exceptions, so  Q1 2015          159         11.2%
            this statistic should be interpreted with care.                  Q4 2014                111        -17.2%
                                                                             Q3 2014                147        -25.0%
                                                                             Q2 2014                161        -14.8%

                            2013                  2014                  2015                  2016
              250
              200
       Cash Sales  150

              100
              50
               0
                   Q1    Q2   Q3    Q4   Q1    Q2   Q3    Q4   Q1    Q2   Q3    Q4    Q1   Q2    Q3   Q4    Q1   Q2


                                                                                                Percent of Closed   Percent Change
         Cash Sales as a Percentage of Closed Sales                          Quarter            Sales Paid in Cash  Year-over-Year
                                                                             Q2 2017               44.1%        -0.7%
         The percentage of Closed Sales during the quarter                   Q1 2017               48.2%        -8.9%
         which were Cash Sales                                               Q4 2016               50.2%        -7.9%
                                                                             Q3 2016               47.3%        -5.4%
                                                                             Q2 2016               44.4%        6.0%
                                                                             Q1 2016               52.9%        26.9%
                                                                             Q4 2015               54.5%        67.2%
            Economists' note : This statistic is simply another way of viewing
            Cash Sales. The remaining percentages of Closed Sales (i.e. those not  Q3 2015         50.0%        38.9%
            paid fully in cash) each quarter involved some sort of financing, such  Q2 2015        41.9%        1.0%
            as mortgages, owner/seller financing, assumed loans, etc.        Q1 2015               41.7%        6.6%
                                                                             Q4 2014               32.6%        -8.9%
                                                                             Q3 2014               36.0%       -16.7%
                                                                             Q2 2014               41.5%        2.5%

                            2013                  2014                  2015                  2016
             60%
             50%
       Pct. of Closed   Sales Paid in Cash  40%
             30%
             20%
             10%
              0%
                   Q1    Q2   Q3    Q4   Q1    Q2   Q3    Q4   Q1    Q2   Q3    Q4    Q1   Q2    Q3   Q4    Q1   Q2

     Produced by Florida REALTORS® with data provided by Florida's multiple listing services. Statistics for each month compiled from MLS feeds on the 15th day of the following month.
     Data released on Wednesday, August 9, 2017. Next quarterly data release is Thursday, November 2, 2017.
   1   2   3   4   5   6   7