
Page 4 - Bay_County_Townhouses_and_Condos_2017-Q2_Detail_Neat
P. 4
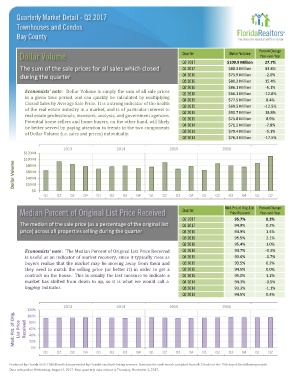
Quarterly Market Detail - Q2 2017
        Townhouses and Condos

        Bay County


                                                                                                             Percent Change
         Dollar Volume                                                       Quarter             Dollar Volume  Year-over-Year
                                                                             Q2 2017            $109.9 Million  27.7%
         The sum of the sale prices for all sales which closed               Q1 2017            $88.3 Million   33.8%
         during the quarter                                                  Q4 2016            $75.9 Million   -2.0%
                                                                             Q3 2016            $80.2 Million   15.4%
                                                                             Q2 2016            $86.1 Million   -5.1%
            Economists' note : Dollar Volume is simply the sum of all sale prices  Q1 2016      $66.1 Million  -12.8%
            in a given time period, and can quickly be calculated by multiplying
            Closed Sales by Average Sale Price. It is a strong indicator of the health  Q4 2015  $77.5 Million  8.4%
            of the real estate industry in a market, and is of particular interest to  Q3 2015  $69.5 Million  -12.5%
            real estate professionals, investors, analysts, and government agencies.  Q2 2015   $90.7 Million   18.8%
            Potential home sellers and home buyers, on the other hand, will likely  Q1 2015     $75.8 Million   8.9%
            be better served by paying attention to trends in the two components  Q4 2014       $71.5 Million   -7.8%
            of Dollar Volume (i.e. sales and prices) individually.           Q3 2014            $79.4 Million   -5.1%
                                                                             Q2 2014            $76.3 Million  -17.5%

                            2013                  2014                  2015                  2016
           $120 M
           $100 M
       Dollar Volume  $60 M
            $80 M

            $40 M
            $20 M
              $0
                   Q1    Q2   Q3    Q4   Q1    Q2   Q3    Q4   Q1    Q2   Q3    Q4    Q1   Q2    Q3   Q4    Q1   Q2


                                                                                               Med. Pct. of Orig. List   Percent Change
         Median Percent of Original List Price Received                      Quarter             Price Received  Year-over-Year
                                                                             Q2 2017               95.7%        0.3%
         The median of the sale price (as a percentage of the original list   Q1 2017              94.9%        0.2%
         price) across all properties selling during the quarter             Q4 2016               94.9%        1.4%
                                                                             Q3 2016               95.5%        2.1%
                                                                             Q2 2016               95.4%        1.0%
            Economists' note : The Median Percent of Original List Price Received  Q1 2016         94.7%        -0.3%
            is useful as an indicator of market recovery, since it typically rises as  Q4 2015     93.6%        -0.7%
            buyers realize that the market may be moving away from them and  Q3 2015               93.5%        0.2%
            they need to match the selling price (or better it) in order to get a  Q2 2015         94.5%        0.0%
            contract on the house. This is usually the last measure to indicate a  Q1 2015         95.0%        1.2%
            market has shifted from down to up, so it is what we would call a  Q4 2014             94.3%        -0.5%
            lagging  indicator.                                              Q3 2014               93.3%        -1.1%
                                                                             Q2 2014               94.5%        0.4%

                            2013                  2014                  2015                  2016
            120%
       Med. Pct. of Orig.   List Price   Received  80%
            100%

             60%
             40%
             20%
              0%
                   Q1    Q2   Q3    Q4   Q1    Q2   Q3    Q4   Q1    Q2   Q3    Q4    Q1   Q2    Q3   Q4    Q1   Q2

     Produced by Florida REALTORS® with data provided by Florida's multiple listing services. Statistics for each month compiled from MLS feeds on the 15th day of the following month.
     Data released on Wednesday, August 9, 2017. Next quarterly data release is Thursday, November 2, 2017.