
Page 3 - Bay_County_Townhouses_and_Condos_2017-Q2_Detail_Neat
P. 3
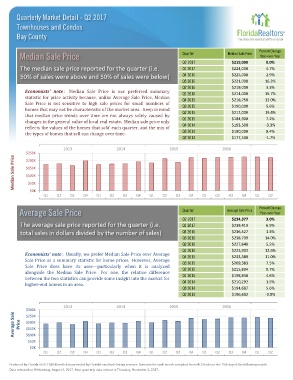
Quarterly Market Detail - Q2 2017
        Townhouses and Condos

        Bay County


                                                                                                             Percent Change
                                                                                                Median Sale Price
         Median Sale Price                                                   Quarter                          Year-over-Year
                                                                             Q2 2017              $219,000      0.0%
         The median sale price reported for the quarter (i.e.                Q1 2017              $224,000      4.7%
         50% of sales were above and 50% of sales were below)                Q4 2016              $225,000      2.9%
                                                                             Q3 2016              $221,000      16.3%
                                                                             Q2 2016              $219,000      3.3%
            Economists' note : Median Sale Price is our preferred summary    Q1 2016              $214,000      15.7%
            statistic for price activity because, unlike Average Sale Price, Median
            Sale Price is not sensitive to high sale prices for small numbers of  Q4 2015         $218,750      13.0%
            homes that may not be characteristic of the market area. Keep in mind  Q3 2015        $190,000      5.6%
            that median price trends over time are not always solely caused by  Q2 2015           $212,000      19.4%
            changes in the general value of local real estate. Median sale price only  Q1 2015    $184,900      7.2%
            reflects the values of the homes that sold each quarter, and the mix of  Q4 2014      $193,500      -3.3%
            the types of homes that sell can change over time.               Q3 2014              $180,000      8.4%
                                                                             Q2 2014              $177,500      -1.7%

                            2013                  2014                  2015                  2016
            $250K
       Median Sale Price  $150K
            $200K


            $100K
             $50K
              $0K
                   Q1    Q2   Q3    Q4   Q1    Q2   Q3    Q4   Q1    Q2   Q3    Q4    Q1   Q2    Q3   Q4    Q1   Q2


                                                                                                             Percent Change
         Average Sale Price                                                  Quarter            Average Sale Price  Year-over-Year
                                                                             Q2 2017              $234,377      3.0%
         The average sale price reported for the quarter (i.e.               Q1 2017              $239,419      6.9%
         total sales in dollars divided by the number of sales)              Q4 2016              $236,527      1.3%
                                                                             Q3 2016              $238,709      14.0%
                                                                             Q2 2016              $227,648      5.5%
                                                                             Q1 2016              $223,903      12.6%
            Economists' note : Usually, we prefer Median Sale Price over Average
            Sale Price as a summary statistic for home prices. However, Average  Q4 2015          $233,380      11.0%
            Sale Price does have its uses—particularly when it is analyzed   Q3 2015              $209,383      7.5%
            alongside the Median Sale Price. For one, the relative difference  Q2 2015            $215,834      9.7%
            between the two statistics can provide some insight into the market for  Q1 2015      $198,838      4.6%
            higher-end homes in an area.                                     Q4 2014              $210,292      1.5%
                                                                             Q3 2014              $194,687      5.6%
                                                                             Q2 2014              $196,682      -0.8%

                            2013                  2014                  2015                  2016
            $300K
       Average Sale   Price  $200K
            $250K

            $150K
            $100K
             $50K
              $0K
                   Q1    Q2   Q3    Q4   Q1    Q2   Q3    Q4   Q1    Q2   Q3    Q4    Q1   Q2    Q3   Q4    Q1   Q2

     Produced by Florida REALTORS® with data provided by Florida's multiple listing services. Statistics for each month compiled from MLS feeds on the 15th day of the following month.
     Data released on Wednesday, August 9, 2017. Next quarterly data release is Thursday, November 2, 2017.