
Page 5 - Bay_County_Townhouses_and_Condos_2017-Q2_Detail_Neat
P. 5
Quarterly Market Detail - Q2 2017
Townhouses and Condos
Bay County
Median Time to Percent Change
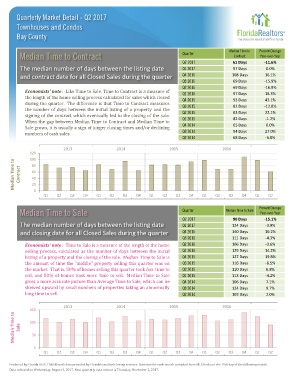
Median Time to Contract Quarter Contract Year-over-Year
Q2 2017 61 Days -11.6%
The median number of days between the listing date Q1 2017 97 Days 0.0%
and contract date for all Closed Sales during the quarter Q4 2016 108 Days 16.1%
Q3 2016 69 Days -15.9%
Q2 2016 69 Days -16.9%
Economists' note : Like Time to Sale, Time to Contract is a measure of Q1 2016 97 Days 18.3%
the length of the home selling process calculated for sales which closed
during the quarter. The difference is that Time to Contract measures Q4 2015 93 Days 43.1%
the number of days between the initial listing of a property and the Q3 2015 82 Days -12.8%
signing of the contract which eventually led to the closing of the sale. Q2 2015 83 Days 22.1%
When the gap between Median Time to Contract and Median Time to Q1 2015 82 Days -1.2%
Sale grows, it is usually a sign of longer closing times and/or declining Q4 2014 65 Days 0.0%
numbers of cash sales. Q3 2014 94 Days 27.0%
Q2 2014 68 Days -6.8%
2013 2014 2015 2016
120
Median Time to Contract 80
100
60
40
20
0
Q1 Q2 Q3 Q4 Q1 Q2 Q3 Q4 Q1 Q2 Q3 Q4 Q1 Q2 Q3 Q4 Q1 Q2
Percent Change
Median Time to Sale Quarter Median Time to Sale Year-over-Year
Q2 2017 90 Days -15.1%
The median number of days between the listing date Q1 2017 124 Days -3.9%
and closing date for all Closed Sales during the quarter Q4 2016 140 Days 10.2%
Q3 2016 111 Days -4.3%
Economists' note : Time to Sale is a measure of the length of the home Q2 2016 106 Days -3.6%
selling process, calculated as the number of days between the initial Q1 2016 129 Days 14.2%
listing of a property and the closing of the sale. Median Time to Sale is Q4 2015 127 Days 19.8%
the amount of time the "middle" property selling this quarter was on Q3 2015 116 Days -6.5%
the market. That is, 50% of homes selling this quarter took less time to Q2 2015 110 Days 6.8%
sell, and 50% of homes took more time to sell. Median Time to Sale Q1 2015 113 Days -4.2%
gives a more accurate picture than Average Time to Sale, which can be Q4 2014 106 Days 7.1%
skewed upward by small numbers of properties taking an abnormally Q3 2014 124 Days 9.7%
long time to sell. Q2 2014 103 Days 2.0%
2013 2014 2015 2016
150
Median Time to Sale 100
50
0
Q1 Q2 Q3 Q4 Q1 Q2 Q3 Q4 Q1 Q2 Q3 Q4 Q1 Q2 Q3 Q4 Q1 Q2
Produced by Florida REALTORS® with data provided by Florida's multiple listing services. Statistics for each month compiled from MLS feeds on the 15th day of the following month.
Data released on Wednesday, August 9, 2017. Next quarterly data release is Thursday, November 2, 2017.