Page 11 - PR 2014 2016 05 Renewable Energies
P. 11

Renewable Energies | Progress Report  113


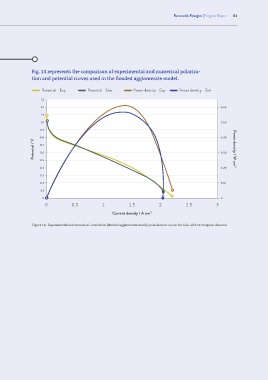
               Fig. 14 represents the comparison of experimental and numerical polariza-
               tion and potential curves used in the flooded agglomerate model.

                    Potential - Exp     Potential - Sim     Power density - Exp  Power density - Sim

                   1.3
                   1.2                                                                             0.60
                   1.1
                   1.0                                                                             0.50
                   0.9

                   0.8                                                                             0.40
                Potential / V  0.7                                                                 0.30  Power density / W cm -2

                   0.6
                   0.5
                   0.4                                                                             0.20
                   0.3
                   0.2                                                                             0.10
                   0.1
                    0                                                                              0
                     0           0.5          1           1.5           2           2.5          3
                                                   Current density / A cm -2


               Figure 14.  Experimental and numerical simulation (flooded agglomerate model) polarization curves for cells with rectangular channel.
   6   7   8   9   10   11   12   13   14   15   16