
Page 7 - PR 2014 2016 05 Renewable Energies
P. 7
Renewable Energies | Progress Report 109
Effect of TiO Content on Oxidation
2
Ethanol Electrooxidation of ammonia
in Alkaline Media Using Pt using PtRh/C Pt/C
Nanoparticles Supported electrocatalysts:
on Physical Mixtures Fuel cell and
of Carbon and TiO as electrochemical
2 PtRh/C (90:10)
Electrocatalysts (Fig. 4). evaluation (Fig. 5).
16 Intensity (Arb. units)
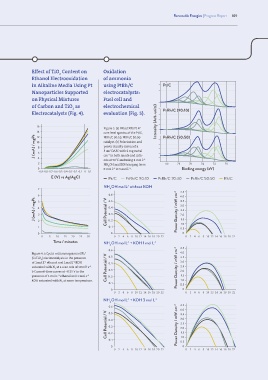
Figure 5. (a) Fitted XPS Pt 4f
14 core level spectra of the Pt/C, PtRh/C (50:50)
J (mA) / mgPt 10 8 6 catalyst. (b) Polarization and
12
PtRh/C 90:10, PtRh/C 50:50
power density curves of a
5 cm DAFC with 2 mg metal
2
cm in both anode and cath-
−2
4
ode at 50°C and using 1 mol L
−1
2 NH OH and KOH ranging from 80 78 76 74 72 70
4
0 0 mol L to 3 mol L . Binding energy (eV)
−1
−1
-0.9 -0.8 -0.7 -0.6 -0.5 -0.4 -0.3 -0.2 -0.1 0 0.1
E (V) vs Ag/AgCl Pt/C PtRh/C 90:10 PtRh/C 70:30 PtRh/C 50:50 Rh/C
NH OH mol L without KOH
-1
7 4 4.5
6 5 0.6 4.0
J (mA) / mgPt 4 3 Cell Potential / V 0.4 Power Density / mW cm -2 3.0
3.5
0.5
2.5
0.3
2.0
1.5
1.0
0. 1
1 2 0. 2 0.5
0 0 0
0 5 10 15 20 25 30 0 2 4 6 8 10 12 14 16 18 20 22 0 2 4 6 8 10 12 14 16 18 20 22
Time / minutes NH OH mol L + KOH 1 mol L -1
-1
4
0.6 4.5
Figure 4. a Cyclic voltammograms of Pt/ 4.0
(C+TiO ) electrocatalysts in the presence 0.5 3.5
2
of 1mol L ethanol and 1mol L KOH 0.4 3.0
−1
−1
saturated with N at a scan rate of 10 mV s . Cell Potential / V Power Density / mW cm -2 2.5
−1
2
b Current-time curves at −0.35 V in the 0.3 2.0
presence of 1 mol L ethanol and 1 mol L 0. 2 1.5
−1
−1
1.0
KOH saturated with N at room temperature. 0. 1 0.5
2
0 0
0 2 4 6 8 10 12 14 16 18 20 22 0 2 4 6 8 10 12 14 16 18 20 22
NH OH mol L + KOH 3 mol L -1
-1
4
4.5
0.6 4.0
Cell Potential / V 0.4 Power Density / mW cm -2 3.0
0.5
3.5
2.5
0.3
2.0
1.5
0. 2
1.0
0. 1 0.5
0 0
0 2 4 6 8 10 12 14 16 18 20 22 0 2 4 6 8 10 12 14 16 18 20 22