
Page 9 - PR 2014 2016 05 Renewable Energies
P. 9
Renewable Energies | Progress Report 111
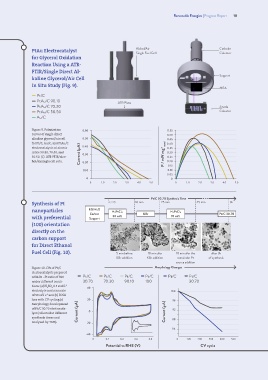
PtAu Electrocatalyst Alchol/Air Cathode
Colector
Single Fuel Cell
for Glycerol Oxidation
Reaction Using a ATR-
FTIR/Single Direct Al-
Support
kaline Glycerol/Air Cell
In Situ Study (Fig. 9).
MEA
Pt/C
PtAu/C 90.10 ATR Plate
PtAu/C 70.30 Anode
PtAu/C 50.50 Colector
Au/C
Figure 9. Polarization 0.60 0.55
curves of single direct 0.50
alkaline glycerol/air cell 0.50 0.45
for Pt/C, Au/C, and PtAu/C metal 0.40
electrocatalysts at atomic 0.40 0.35
ratios 90:10, 70:30, and Current (µA) 0.30 0.30
50:50. (C) ATR-FTIR/alco- P / mW mg -1 0.25
hol/airsingle cell setu. 0.20 0.20
0.15
0.10 0.10
0.05
0 0
0 1.0 2.0 3.0 4.0 5.0 0 1.0 2.0 3.0 4.0 5.0
Pt/C 30.70 Synthesis Time
Synthesis of Pt t = 0 10 min 25 min 45 min 3h
nanoparticles EG/H 2O
Carbon H 2PtCl 6 KBr H 2PtCl 6 Pt/C 30.70
with preferential Support 30 wt% 70 wt%
(100) orientation
directly on the
carbon support
for Direct Ethanol
Fuel Cell (Fig. 10). 5 min before 10 min afer 10 min afer the after 3h
KBr addition KBr addition remainder Pt of synthesis
source addition
Figure 10. CVs of Pt/C Morphology Changes
electrocatalysts prepared
with Br -:Pt ratio of 300 Pt/C Pt/C Pt/C Pt/C Pt/C Pt/C
under different condi- 30.70 70.30 90.10 100 30.70
tions: (a) H SO 0.5 mol L 40
-1
2
4
electrolyte and scan rate 100
of 50 mV s and (b) ECSA
-1
loss with CV cycling.(c) 20 96
Morphology development
of Pt/C 30.70 electrocata- 92
lyst (collected at different Current (µA) 0 Current (µA)
synthesis times and 88
analyzed by TEM). -20
84
-40
0 0.2 0.4 0.6 0.8 0 100 200 300 400 500
Potential vs RHE (V) CV cycle